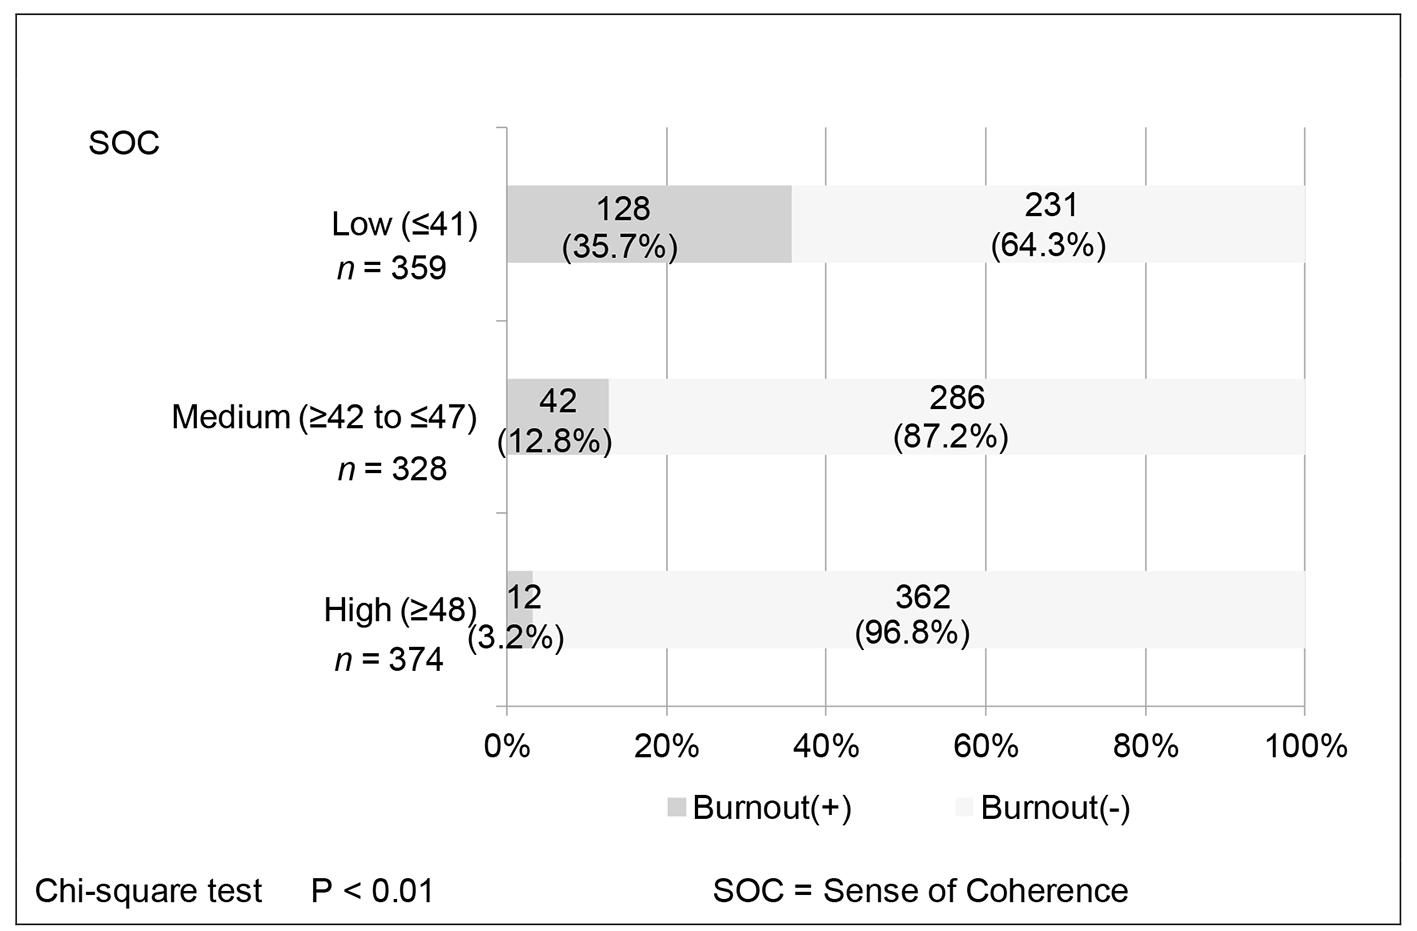
Figure 1. Relationship between burnout and the three SOC groups.
| Journal of Clinical Medicine Research, ISSN 1918-3003 print, 1918-3011 online, Open Access |
| Article copyright, the authors; Journal compilation copyright, J Clin Med Res and Elmer Press Inc |
| Journal website http://www.jocmr.org |
Original Article
Volume 10, Number 3, March 2018, pages 226-232
Stress Factors Associated With Burnout Among Attending Physicians: A Cross-Sectional Study
Figure
Tables
| Characteristic | Value |
|---|---|
| SD: standard deviation; SOC: sense of coherence; BSJS: brief scales for job stress. an = 834. | |
| Age, years (mean ± SD) | 40.8 ± 6.9 |
| Physician experience, years (mean ± SD) | 15.3 ± 6.7 |
| Sex, n (%) | |
| Male | 892 (84.1) |
| Female | 169 (15.9) |
| Frequency of resident instruction, n (%) | |
| Almost every day | 336 (31.7) |
| 4-5 times a week | 219 (20.6) |
| 2-3 times a week | 269 (25.4) |
| Once a week | 106 (10.0) |
| Less than once a week | 131 (12.3) |
| Mean number of hours worked per weeka (mean ± SD) | 79.3 ± 17.2 |
| < 60, n (%) | 84 (10.1) |
| ≥ 60 to < 80, n (%) | 394 (47.2) |
| ≥ 80 to < 100, n (%) | 256 (30.7) |
| ≥ 100, n (%) | 100 (12.0) |
| Burnout, n (%) | 182 (17.2) |
| SOC score (mean ± SD) | 44.5 ± 7.3 |
| Low (≤ 41), n (%) | 359 (33.8) |
| Medium (≥ 42 to ≤ 47), n (%) | 328 (30.9) |
| High (≥ 48), n (%) | 374 (35.2) |
| BSJS score (mean ± SD) | |
| Stress factors | |
| Workload | 2.5 ± 0.74 |
| Mental workload | 2.2 ± 0.70 |
| Problems in personal relationships | 1.8 ± 0.69 |
| Buffering factors | |
| Job control | 2.8 ± 0.68 |
| Reward from work | 3.2 ± 0.69 |
| Support from colleagues and superiors | 2.9 ± 0.61 |
| Burnout (-), n = 879 | Burnout (+), n = 182 | P value | |
|---|---|---|---|
| SD: standard deviation; SOC: sense of coherence; BSJS: Brief Scales for Job Stress. at-test. bChi-square test. cn = 834. | |||
| Agea, years (mean ± SD) | 41.0 ± 6.9 | 39.6 ± 6.4 | 0.02 |
| Physician experiencea, years (mean ± SD) | 15.6 ± 6.8 | 14.0 ± 6.2 | < 0.01 |
| Sexb, n (%) | < 0.01 | ||
| Male | 751 (86.4) | 141 (78.5) | |
| Female | 128 (14.6) | 41 (22.5) | |
| Mean number of hours worked per weekb, c (mean ± SD) | 78.1 ± 17.2 | 84.6 ± 16.6 | < 0.01 |
| < 60, n (%) | 80 (95.2) | 4 (4.8) | < 0.01 |
| ≥ 60 to < 80, n (%) | 333 (84.5) | 61 (15.5) | |
| ≥ 80 to < 100, n (%) | 198 (77.3) | 58 (22.7) | |
| ≥ 100, n (%) | 67 (67.0) | 33 (33.0) | |
| SOC scorea (mean ± SD) | 45.8 ± 6.6 | 37.8 ± 6.6 | < 0.01 |
| BSJS scorea (mean ± SD) | |||
| Workload | 2.4 ± 0.72 | 2.9 ± 0.69 | < 0.01 |
| Mental workload | 2.1 ± 0.63 | 2.8 ± 0.72 | < 0.01 |
| Problems in personal relationships | 1.7 ± 0.65 | 2.2 ± 0.74 | < 0.01 |
| Buffering factors | |||
| Job control | 2.9 ± 0.65 | 2.5 ± 0.72 | < 0.01 |
| Reward from work | 3.3 ± 0.65 | 2.7 ± 0.71 | < 0.01 |
| Support from colleagues and superiors | 2.9 ± 0.60 | 2.7 ± 0.62 | < 0.01 |
| Variable | OR | 95% CI | P value |
|---|---|---|---|
| OR: odds ratio; CI: confidence interval; SOC: sense of coherence; BSJS: brief scales for job stress. | |||
| Physician experience | 1.0 | 0.97 - 1.04 | 0.86 |
| Sex | |||
| Male | 1 | ||
| Female | 3.0 | 1.70 - 5.32 | < 0.01 |
| SOC score | |||
| Low | 4.7 | 2.31 - 9.63 | < 0.01 |
| Medium | 2.8 | 1.32 - 5.76 | < 0.01 |
| High | 1 | ||
| Mean number of hours worked per week | |||
| < 60 | 1 | ||
| ≥ 60 to < 80 | 4.4 | 1.42 - 13.70 | 0.01 |
| ≥ 80 to < 100 | 6.1 | 1.91 - 19.35 | < 0.01 |
| ≥ 100 | 7.8 | 2.21 - 27.42 | < 0.01 |
| BSJS score | |||
| Mental workload | 3.5 | 2.52 - 5.00 | < 0.01 |
| Reward from work | 0.3 | 0.23 - 0.46 | < 0.01 |