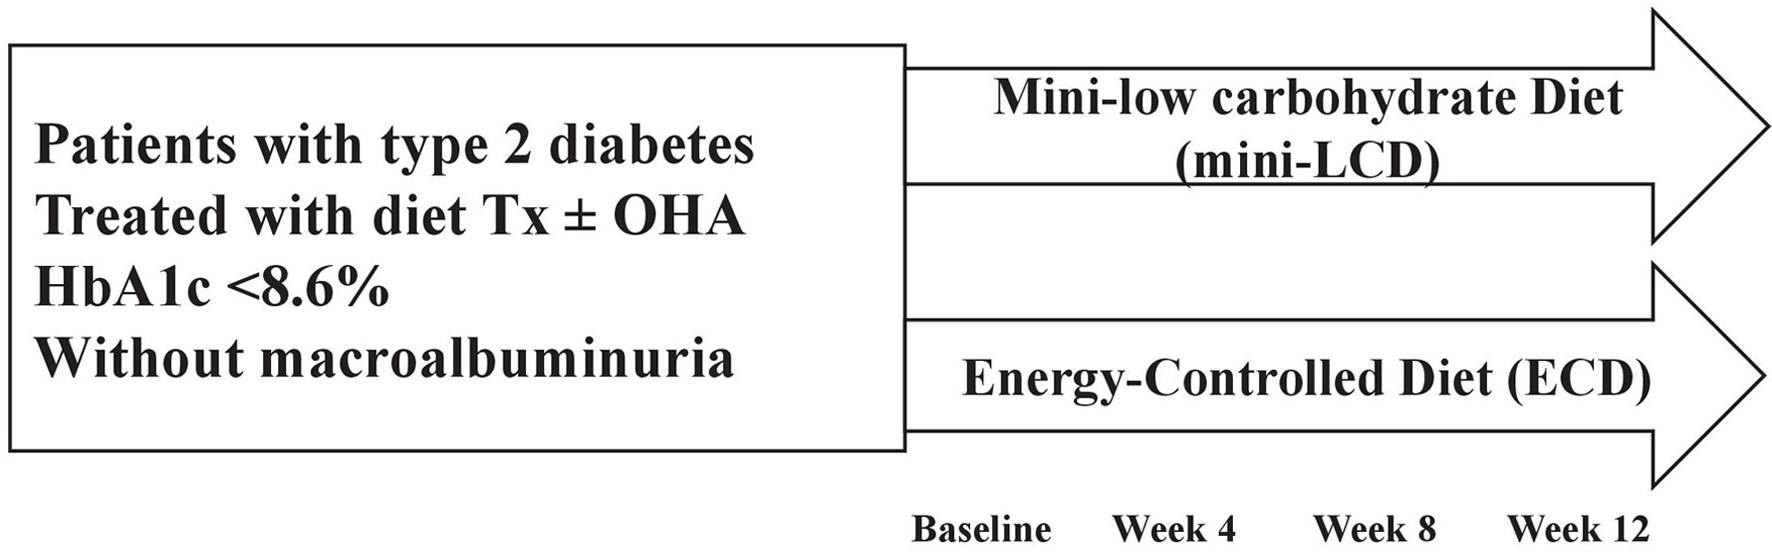
Figure 1. Study design. Mini-LCD: mini low-carbohydrate diet; ECD: energy-controlled diet; Tx: therapy; OHA: oral hypoglycemic agent.
| Journal of Clinical Medicine Research, ISSN 1918-3003 print, 1918-3011 online, Open Access |
| Article copyright, the authors; Journal compilation copyright, J Clin Med Res and Elmer Press Inc |
| Journal website http://www.jocmr.org |
Original Article
Volume 10, Number 3, March 2018, pages 182-188
A Randomized Controlled Trial of a Mini Low-Carbohydrate Diet and an Energy-Controlled Diet Among Japanese Patients With Type 2 Diabetes
Figures
Tables
| Before propensity score matching | After propensity score matching | |||||
|---|---|---|---|---|---|---|
| Mini low-carbohydrate diet group | Energy-controlled diet group | P value | Mini low-carbohydrate diet group | Energy-controlled diet group | P value | |
| Data are expressed as means ± standard error or median values (interquartile ranges); P values between two groups were determined using the t-test. One-to-one nearest-neighbor matching with replacement based on propensity score was performed. To test the approach and maximize the number of matching, the process was repeated without a replacement option, using calipers and logit of the propensity score. Calipers of width equal to 0.25 of the standard deviation of the logit score. BMI: body mass index; HbA1c: glycosylated hemoglobin; HDL: high-density lipoprotein; LDL: low-density lipoprotein. | ||||||
| Number | 25 | 23 | 12 | 12 | ||
| Men/women (n) | 8/17 | 8/15 | 0.92 | 2/10 | 4/8 | 0.35 |
| Age (years) | 64.4 ± 2.3 | 65.2 ± 2.2 | 0.82 | 64.4 ± 3.2 | 66.0 ± 3.2 | 0.73 |
| Diabetes duration (years) | 11.2 ± 1.90 | 13.3 ± 2.0 | 0.46 | 12.2 ± 3.2 | 8.5 ± 3.2 | 0.42 |
| Body weight (kg) | 67.1 ± 2.4 | 58.2 ± 2.5 | 0.01 | 59.2 ± 3.0 | 60.7 ± 3.0 | 0.73 |
| BMI (kg/m2) | 26.6 ± 4.3 | 22.9 ± 3.5 | 0.01 | 24.4 ± 1.1 | 23.8 ± 1.1 | 0.71 |
| Waist circumference (cm) | 88.2 ± 1.7 | 81.0 ± 1.8 | 0.01 | 84.3 ± 2.7 | 84.2 ± 2.7 | 0.99 |
| HbA1c (%) | 7.0 ± 0.1 | 7.0 ± 0.1 | 0.96 | 7.0 ± 0.2 | 7.0 ± 0.2 | 0.88 |
| HDL-cholesterol (mg/dL) | 60.2 ± 3.3 | 60.9 ± 3.4 | 0.88 | 65.3 ± 6.0 | 62.3 ± 6.0 | 0.72 |
| LDL-cholesterol (mg/dL) | 113.2 ± 5.4 | 115.7 ± 5.6 | 0.75 | 107.0 ± 6.7 | 131.0 ± 6.7 | 0.018 |
| Triglycerides (mg/dL) | 158 (122 - 194) | 121 (89 - 164) | 0.22 | 173 (110 - 236) | 114 (52 - 177) | 0.19 |
| Basal energy expenditure (kcal/day) | 1,338.7 ± 42.1 | 1,278.1 ± 44.9 | 0.34 | 1,228.0 ± 52.6 | 1,320.7 ± 52.6 | 0.23 |
| Fat mass (%) | 32.3 ± 1.7 | 28.7 ± 1.8 | 0.10 | 32.2 ± 2.6 | 29.4 ± 2.6 | 0.47 |
| Diet treatment only/diet treatment plus oral hypoglycemic agents | 10/15 | 10/13 | 0.68 | 7/5 | 5/7 | 0.70 |
| DTSQ total score | 24.1 ± 2.2 | 25.5 ± 2.4 | 0.67 | 26.3 ± 3.4 | 22.8 ± 3.7 | 0.49 |
| Before propensity score matching | After propensity score matching | ||||||||||||
|---|---|---|---|---|---|---|---|---|---|---|---|---|---|
| Baseline | 4 weeks | 8 weeks | 12 weeks | Change from the baseline | P value | Baseline | 4 weeks | 8 weeks | 12 weeks | Change from the baseline | P value | ||
| Data are expressed as means ± standard error. P values between two groups were determined using the t-test. Chi-squared test was used for categorical variables, and Mann-Whitney U test for continuous non-normally distributed variables. Multiple imputations were used to adjust for age, sex, body weight, HbA1c, basal energy expenditure, waist circumference, and height. The percentages of nutrient energy per daily energy intake are also shown before and after propensity score matching. Mini-LCD: mini low-carbohydrate diet; ECD: energy-restricted diet; HbA1c: glycosylated hemoglobin; 1,5-AG: 1,5-anhydroglucitol; LDL-C: low-density lipoprotein cholesterol; HDL-C: high-density lipoprotein cholesterol; TG: triglyceride; DTSQ: Diabetes Treatment Satisfaction Questionnaire; Q2: question 2; Q3: question 3. | |||||||||||||
| HbA1c (%) | Mini-LCD | 7.0 ± 0.1 | 6.8 ± 0.1 | 6.8 ± 0.1 | 6.7 ± 0.1 | -0.2 ± 0.07 | 0.60 | 7.03 ± 0.16 | 6.97 ± 0.16 | 6.91 ± 0.14 | 6.85 ± 0.15 | -0.2 ± 0.1 | 0.95 |
| ECD | 7.0 ± 0.1 | 6.9 ± 0.1 | 6.8 ± 0.1 | 6.8 ± 0.1 | -0.2 ± 0.07 | 7.00 ± 0.16 | 6.92 ± 0.16 | 6.85 ± 0.14 | 6.81 ± 0.15 | -0.2 ± 0.09 | |||
| Glycated albumin (%) | Mini-LCD | 17.7 ± 0.4 | 17.6 ± 0.4 | -0.1 ± 0.3 | 0.37 | 17.9 ± 0.4 | 18.3 ± 0.5 | 0.5 ± 0.4 | 0.32 | ||||
| ECD | 18.5 ± 0.4 | 18.3 ± 0.4 | -0.2 ± 0.3 | 18.7 ± 0.4 | 18.6 ± 0.5 | -0.1 ± 0.4 | |||||||
| 1,5 AG | Mini-LCD | 10.4 ± 1.4 | 10.8 ± 1.5 | 0.3 ± 0.5 | 0.30 | 8.2 ± 1.8 | 7.9 ± 1.8 | -0.4 ± 0.7 | 0.20 | ||||
| ECD | 9.9 ± 1.5 | 10.9 ± 1.6 | 1.0 ± 0.5 | 9.8 ± 1.8 | 10.7 ± 1.8 | 0.9 ± 0.7 | |||||||
| Body weight (kg) | Mini-LCD | 67.1 ± 2.4 | 66.3 ± 2.5 | 65.8 ± 2.4 | 66.0 ± 2.4 | -1.1 ± 0.3 | 0.04 | 59.2 ± 3.0 | 58.3 ± 3.0 | 58.7 ± 3.0 | 58.7 ± 3.1 | -0.5 ± 0.4 | 0.99 |
| ECD | 58.2 ± 2.5 | 58.0 ± 2.6 | 57.9 ± 2.5 | 58.0 ± 2.50 | -0.3 ± 0.3 | 60.7 ± 2.8 | 60.2 ± 3.0 | 60.2 ± 3.0 | 60.1 ± 3.1 | -0.5 ± 0.4 | |||
| Energy intake (kcal/day) | Mini-LCD | 1,548.4 ± 79.2 | 1,556.2 ± 69.7 | 1,513.8 ± 101.3 | 1,558.5 ± 84.1 | -18.7 ± 91.7 | 0.42 | 1,555.1 ± 90.8 | 1,601.2 ± 85.4 | 1,404.8 ± 72.0 | 1,520.3 ± 87.2 | -21.1 ± 95.1 | 0.29 |
| ECD | 1,661.3 ± 77.1 | 1,647.1 ± 66.0 | 1,725.6 ± 96.0 | 1,538.8 ± 79.5 | -122.5 ± 86.7 | 1,631.0 ± 91.0 | 1,566.6 ± 85.4 | 1,546.3 ± 72.0 | 1,468.0 ± 87.2 | -182.4 ± 105.1 | |||
| Carbohydrate intake (g/day) | Mini-LCD | 200.2 ± 13.4 (51.1± 2.0%) | 208.4 ± 10.0 (53.5± 1.9%) | 190.9 ± 13.1 (50.8± 1.5%) | 194.9 ± 11.2 (50.3± 1.3%) | -9.4 ± 15.4 | 0.62 | 197.8 ± 17.6 (53.1± 2.0%) | 202.1 ± 14.1 (48.8± 2.5%) | 184.1 ± 39.5 (51.1± 1.5%) | 185.7 ± 11.8 (51.0±2.9%) | -9.1 ± 19.3 | 0.59 |
| ECD | 232.8 ± 13.0 (56.1± 2.0%) | 227.7 ± 9.5 (56.0± 1.9%) | 247.2 ± 12.5 (57.7± 1.5%) | 212.8 ± 10.5 (55.5± 1.2%) | -20.0 ± 14.6 | 226.3 ± 18.0 (57.2± 2.0%) | 212.4 ± 14.1 (56.0± 2.5%) | 216.9 ± 38.2 (53.7± 1.5%) | 201.1 ± 11.8 (55.9±20.9%) | -24.0 ± 21.3 | |||
| Protein intake (g/day) | Mini-LCD | 68.4 ± 3.7 (18.1± 0.7%) | 67.8 ± 5.0 (17.4± 0.9%) | 66.2 ± 3.8 (17.8± 0.7%) | 66.2 ± 3.8 (18.4± 0.6%) | 1.5 ± 4.1 | 0.16 | 66.7 ± 4.1 (17.5± 1.3%) | 70.1 ± 5.2 (18.0± 1.2%) | 66.5 ± 3.6 (18.5± 0.9%) | 71.5 ± 4.4 (20.6±1.5%) | 5.2 ± 3.9 | 0.0085 |
| ECD | 68.3 ± 3.6 (16.4± 0.7%) | 66.7 ± 4.7 (16.1± 0.9%) | 63.1 ± 3.6 (14.7± 0.7%) | 63.1 ± 3.6 (16.1± 0.6%) | -6.5 ± 3.9 | 67.5 ± 4.1 (17.0± 1.3%) | 64.3 ± 5.2 (16.3± 1.2%) | 67.9 ± 3.6 (16.0± 0.9%) | 58.3 ± 4.4 (17.3±1.5%) | -10.1 ± 4.3 | |||
| Fat intake (g/day) | Mini-LCD | 47.4 ± 3.5 (27.8± 1.4%) | 49.9 ± 4.0 (29.1± 1.6%) | 52.7 ± 5.2 (30.8± 1.9%) | 52.3 ± 3.7 (30.1± 1.2%) | 4.4 ± 3.8 | 0.34 | 46.7 ± 3.7 (25.4± 2.0%) | 55.2 ± 4.3 (31.7± 1.9%) | 45.5 ± 3.9 (28.2± 1.5%) | 53.9 ± 4.2 (26.2± 2.6%) | 6.4 ± 4.5 | 0.27 |
| ECD | 47.6 ± 3.4 (25.8± 1.4%) | 49.4 ± 3.8 (26.8± 1.5%) | 50.9 ± 4.9 (26.3± 1.5%) | 47.0 ± 3.5 (27.4± 1.2%) | -0.6 ± 3.6 | 45.8 ± 3.7 (23.9± 2.0%) | 50.3 ± 4.3 (26.5±1.9%) | 46.6 ± 3.9 (29.0±1.5%) | 43.2 ± 4.7 (25.3±2.6%) | -2.4 ± 5.0 | |||
| LDL-C (mg/dL) | Mini-LCD | 113.2 ± 5.4 | 116.1 ± 6.9 | 116.8 ± 0.1 | 110.0 ± 6.2 | -3.2 ± 5.3 | 0.98 | 107.0 ± 6.6 | 116.2 ± 11.0 | 117.8 ± 11.1 | 104.0 ± 9.8 | -2.9 ± 9.8 | 0.83 |
| ECD | 115.7 ± 5.6 | 110.9 ± 7.0 | 116.8 ± 0.1 | 112.3 ± 6.5 | -3.4 ± 5.5 | 131.0 ± 6.7 | 125.2 ± 11.0 | 126.2 ± 11.0 | 125.1 ± 10.0 | -5.9 ± 9.8 | |||
| HDL-C (mg/dL) | Mini-LCD | 60.2 ± 3.3 | 60.1 ± 3.1 | 61.2 ± 2.9 | 59.5 ± 4.3 | -0.72 ± 2.3 | 0.37 | 65.3 ± 6.0 | 64.9 ± 14.3 | 64.4 ± 5.1 | 63.5 ± 8.3 | -1.8 ± 4.5 | 0.28 |
| ECD | 60.9 ± 3.4 | 60.5 ± 3.2 | 58.6 ± 3.0 | 63.2 ± 4.5 | 2.3 ± 2.4 | 62.3 ± 6.0 | 80.3 ± 14.2 | 58.1 ± 5.1 | 67.5 ± 8.3 | 5.2 ± 4.5 | |||
| TG (mg/dL) | Mini-LCD | 158 (122 - 194) | 141 (118 - 165) | 128 (97 - 160) | 143 (16 - 112) | -14.9 ± 16.1 | 0.36 | 173 (110 - 236) | 135 (95 - 175) | 152 (77 - 227) | 168 (95 - 240) | -5.4 ± 20.6 | 0.42 |
| ECD | 121 (89 - 164) | 119 (93 - 145) | 137 (105 - 168) | 133 (16 - 100) | 6.5 ± 16.8 | 114 (52 - 177) | 119 (79 - 158) | 152 (77 - 227) | 133 (660 - 206) | 18.4 ± 20.6 | |||
| Ketones (µmol/L) | Mini-LCD | 71.4 ± 9.7 | 101.7 ± 23.7 | 29.5 ± 24.6 | 0.82 | 89.1 ± 15.3 | 85.6 ± 27.3 | -3.5 ± 32.1 | 0.60 | ||||
| ECD | 62.8 ± 10.4 | 82.3 ± 26.0 | 20.8 ± 27.6 | 66.8 ± 15.3 | 87.1 ± 27.3 | 20.3 ± 32.1 | |||||||
| DTSQ total | Mini-LCD | 24.1 ± 2.2 | 29.7 ± 0.9 | 5.6 ± 2.2 | 0.79 | 26.3 ± 3.4 | 30.8 ± 1.1 | 8.4 ± 2.9 | 0.53 | ||||
| ECD | 25.5± 2.4 | 30.0 ± 0.9 | 4.7 ± 2.4 | 22.8 ± 3.7 | 30.5 ± 1.2 | 11.3 ± 3.2 | |||||||
| DTSQ Q2 | Mini-LCD | 2.1 ± 0.3 | 2.7 ± 0.3 | -0.2 ± 0.4 | 0.41 | 2.7 ± 0.6 | 2.4 ± 4.3 | -0.3 ± 0.5 | 0.34 | ||||
| ECD | 1.7 ± 0.3 | 1.7 ± 0.3 | -0.7 ± 0.4 | 2.2 ± 0.7 | 1.8 ± 4.5 | -0.4 ± 0.6 | |||||||
| DTSQ Q3 | Mini-LCD | 1.3 ± 0.2 | 1.7 ± 0.2 | 0.4 ± 0.4 | 0.21 | 1.0 ± 0.2 | 1.3± 0.1 | 0.3 ± 0.3 | 0.36 | ||||
| ECD | 1.4 ± 0.2 | 1.2 ± 0.3 | -0.3 ± 0.4 | 1.2 ± 0.2 | 1.2 ± 0.14 | -0.1 ± 0.3 | |||||||
| Waist circumference (cm) | Mini-LCD | 88.2 ± 1.7 | 87.8 ± 1.7 | -0.7 ± 1.2 | 0.35 | 84.3 ± 2.7 | 84.2 ± 3.7 | -0.08±2.7 | 0.60 | ||||
| ECD | 81.0 ± 1.8 | 78.9 ± 1.8 | -2.3 ± 1.2 | 84.2 ± 2.7 | 82.1 ± 3.7 | -2.1 ± 2.7 | |||||||
| Basal energy expenditure (kcal/day) | Mini-LCD | 1,338.7 ± 43.1 | 1,342.6 ± 41.8 | 0.9 ± 3.2 | 0.23 | 1,228.0 ± 52.6 | 1,234.1 ± 52.8 | 6.1 ± 4.7 | 0.57 | ||||
| ECD | 1,278.1 ± 44.9 | 1,261.9 ± 44.7 | 6.8 ± 3.5 | 1,320.7 ± 52.6 | 1,323.0 ± 52.8 | 2.3 ± 4.7 | |||||||
| Fat mass (%) | Mini-LCD | 32.3 ± 1.7 | 31.0 ± 1.7 | -1.2 ± 0.5 | 0.50 | 32.2 ± 2.6 | 31.0 ± 2.53 | -1.2 ± 0.6 | 0.44 | ||||
| ECD | 28.7 ± 1.8 | 25.9 ± 1.8 | -1.7 ± 0.6 | 29.4 ± 2.6 | 28.9 ± 2.5 | -0.6 ± 0.6 | |||||||
| Muscle mass (kg) | Mini-LCD | 24.4 ± 1.2 | 24.2 ± 1.4 | -0.01 ± 0.1 | 0.59 | 21.3 ± 1.5 | 21.6 ± 1.5 | 0.28 ± 0.10 | 0.086 | ||||
| ECD | 22.8 ± 1.3 | 22.3 ± 1.3 | -0.3 ± 0.1 | 23.9 ± 1.5 | 24.0 ± 1.5 | 0.03 ± 0.10 | |||||||