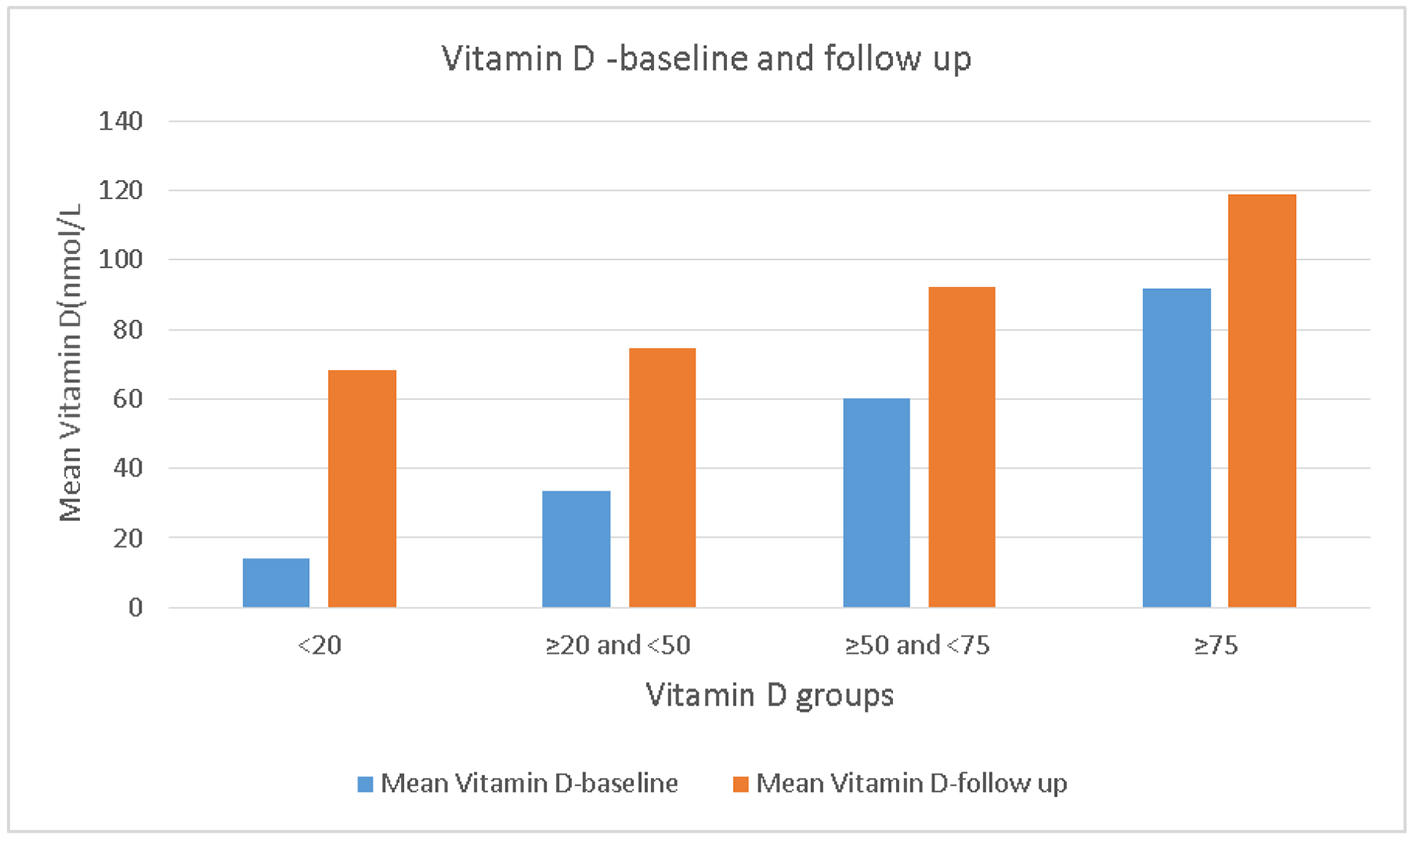
Figure 1. Vitamin D - baseline and follow-up.
| Journal of Clinical Medicine Research, ISSN 1918-3003 print, 1918-3011 online, Open Access |
| Article copyright, the authors; Journal compilation copyright, J Clin Med Res and Elmer Press Inc |
| Journal website http://www.jocmr.org |
Original Article
Volume 9, Number 12, December 2017, pages 1013-1018
Association of Glycosylated Hemoglobin Levels With Vitamin D Status
Figures
Tables
| Baseline characteristics | |
|---|---|
| HbA1c: glycated hemoglobin; TSH: thyroid-stimulating hormone; FT4: free thyroxine; C.Ca: corrected calcium; T1DM: type 1 diabetes mellitus; T2DM: type 2 diabetes mellitus. | |
| Age (years) (mean ± SD) | 43.124 ± 19.46 |
| HbA1c pre-supplementation (%) (mean ± SD) | 10.55 ± 2.58 |
| Vitamin D pre-supplementation (nmol/L) (mean ± SD) | 40.09 ± 23.13 |
| HbA1c post-supplementation (%) (mean ± SD) | 7.70 ± 1.61 |
| Vitamin D post-supplementation (nmol/L) (mean ± SD) | 80.5 ± 29.77 |
| TSH (mIU/L) (mean ± SD) | 2.89 ± 2.48 |
| FT4 (pmol/L) (mean ± SD) | 15.89 ± 8.08 |
| C.Ca (mmol/L) (mean ± SD) | 2.32 ± 0.13 |
| Male, N (%) | 397 (39.7%) |
| Female, N (%) | 603 (60.3%) |
| T1DM, N (%) | 338 (33.8%) |
| T2DM, N (%) | 662 (66.2%) |
| Baseline characteristics | Vitamin D group | P value | |||
|---|---|---|---|---|---|
| < 20 | ≥ 20 and < 50 | ≥ 50 and < 75 | ≥ 75 | ||
| HbA1c: glycated hemoglobin; TSH: thyroid-stimulating hormone; FT4: free thyroxine; C.Ca: corrected calcium; T1DM: type 1 diabetes mellitus; T2DM: type 2 diabetes mellitus. | |||||
| Age (years) (mean ± SD) | 38.61 ± 18.88 | 41.0 ± 19.33 | 49.96 ± 17.5 | 51.64 ± 55.5 | 0.0001 |
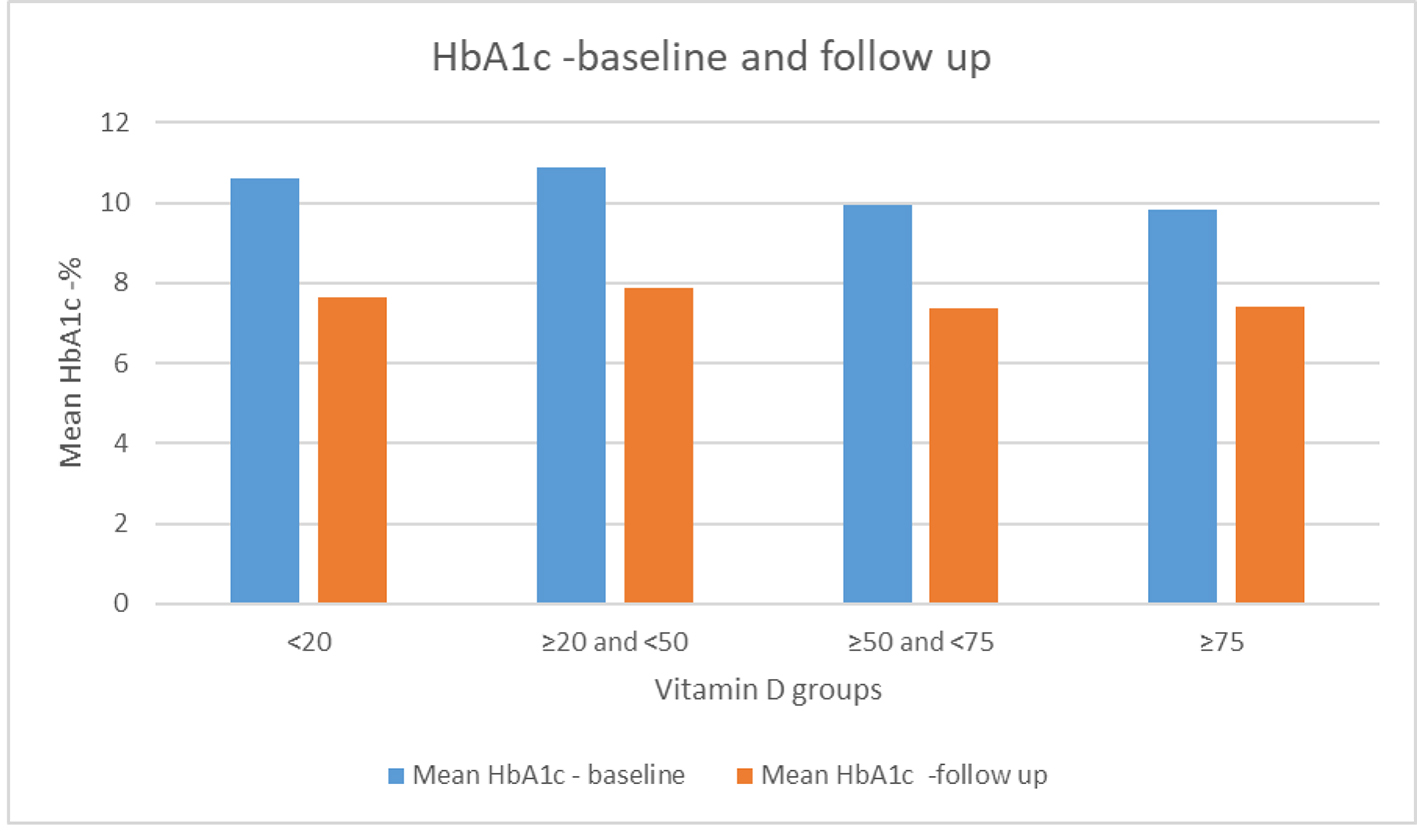
| HbA1c pre-supplementation (%) (mean ± SD) | 10.62 ± 2.45 | 10.86 ± 2.6 | 9.93 ± 2.56 | 9.81 ± 2.52 | 0.0001 |
| Vitamin D pre-supplementation (nmol/L) (mean ± SD) | 14.17 ± 3.88 | 33.58 ± 8.29 | 60.33 ± 7.03 | 91.75 ± 15.14 | 0.0001 |
| HbA1c post-supplementation (%) (mean ± SD) | 7.63 ± 1.61 | 7.89 ± 1.70 | 7.37 ± 1.39 | 7.4 ± 1.16 | 0.0001 |
| Vitamin D post-supplementation (nmol/L) (mean ± SD) | 68.11 ± 29.02 | 74.46 ± 25.82 | 92.27 ± 20.02 | 118.66 ± 31.12 | 0.0003 |
| TSH (mIU/L) (mean ± SD) | 3.15 ± 3.33 | 2.96 ± 2.42 | 2.6 ± 1.99 | 2.52 ± 1.46 | 0.0001 |
| FT4 (pmol/L) (mean ± SD) | 15.44 ± 2.73 | 16.09 ± 10.42 | 15.9 ± 4.67 | 15.69 ± 2.36 | 0.81 |
| C.Ca (mmol/L) (mean ± SD) | 2.3 ± 0.15 | 2.32 ± 0.13 | 2.32 ± 0.12 | 2.34 ± 0.10 | 0.043 |
| Male, N (%) | 56 (30.4%) | 237 (43.3%) | 67 (37.9%) | 37 (40.2%) | 0.019 |
| Female, N (%) | 128 (69.6%) | 310 (56.7%) | 110 (62.1%) | 55 (59.8%) | |
| T1DM, N (%) | 71 (38.6%) | 209 (38.2%) | 37 (20.9%) | 21 (22.8%) | 0.000017 |
| T2DM, N (%) | 113 (61.4%) | 338 (61.8%) | 140 (79.1%) | 71 (77.2%) | |
| Vitamin D | n | Vitamin D baseline (mean ± SD) | HbA1c baseline (mean ± SD) | Vitamin D follow-up (mean ± SD) | HbA1c follow-up (mean ± SD) | Mean change vitamin D (P value) | Mean change HbA1c (P value |
|---|---|---|---|---|---|---|---|
| HbA1c: glycated hemoglobin. | |||||||
| < 20 | 184 | 14.17 ± 3.89 | 10.62 ± 2.45 | 68.11 ± 29.02 | 7.63 ± 1.61 | +53.94 (0.0001) | -2.99 (0.0001) |
| ≥ 20 and < 50 | 547 | 33.58 ± 8.23 | 10.86 ± 2.6 | 74.46 ± 25.84 | 7.89 ± 1.7 | +40.88 (0.0001) | -2.97 (0.0001) |
| ≥ 50 and < 75 | 177 | 60.33 ± 7.03 | 9.93 ± 2.56 | 92.27 ± 20.02 | 7.37 ± 1.39 | +31.94 (0.0001) | -2.56 (0.0001) |
| ≥ 75 | 92 | 91.75 ± 15.14 | 9.81 ± 2.52 | 118.66 ± 31.12 | 7.4 ± 1.16 | +26.91 (0.0001) | -2.41 (0.0001) |
| Vitamin D | n | Vitamin D follow-up (mean ± SD) | HbA1c post-supplementation (mean ± SD) | Coefficient of correlation | P value |
|---|---|---|---|---|---|
| HbA1c: glycated hemoglobin. | |||||
| ≥ 20 and < 50 | 164 | 41.34 ± 5.35 | 7.95 ± 1.70 | -0.02 | 0.79 |
| ≥ 50 and < 75 | 288 | 62.94 ± 7.33 | 8.03 ± 1.84 | 0 | 0.97 |
| ≥ 75 | 548 | 101.5 ± 22.83 | 7.46 ± 1.39 | -0.1 | 0.02 |