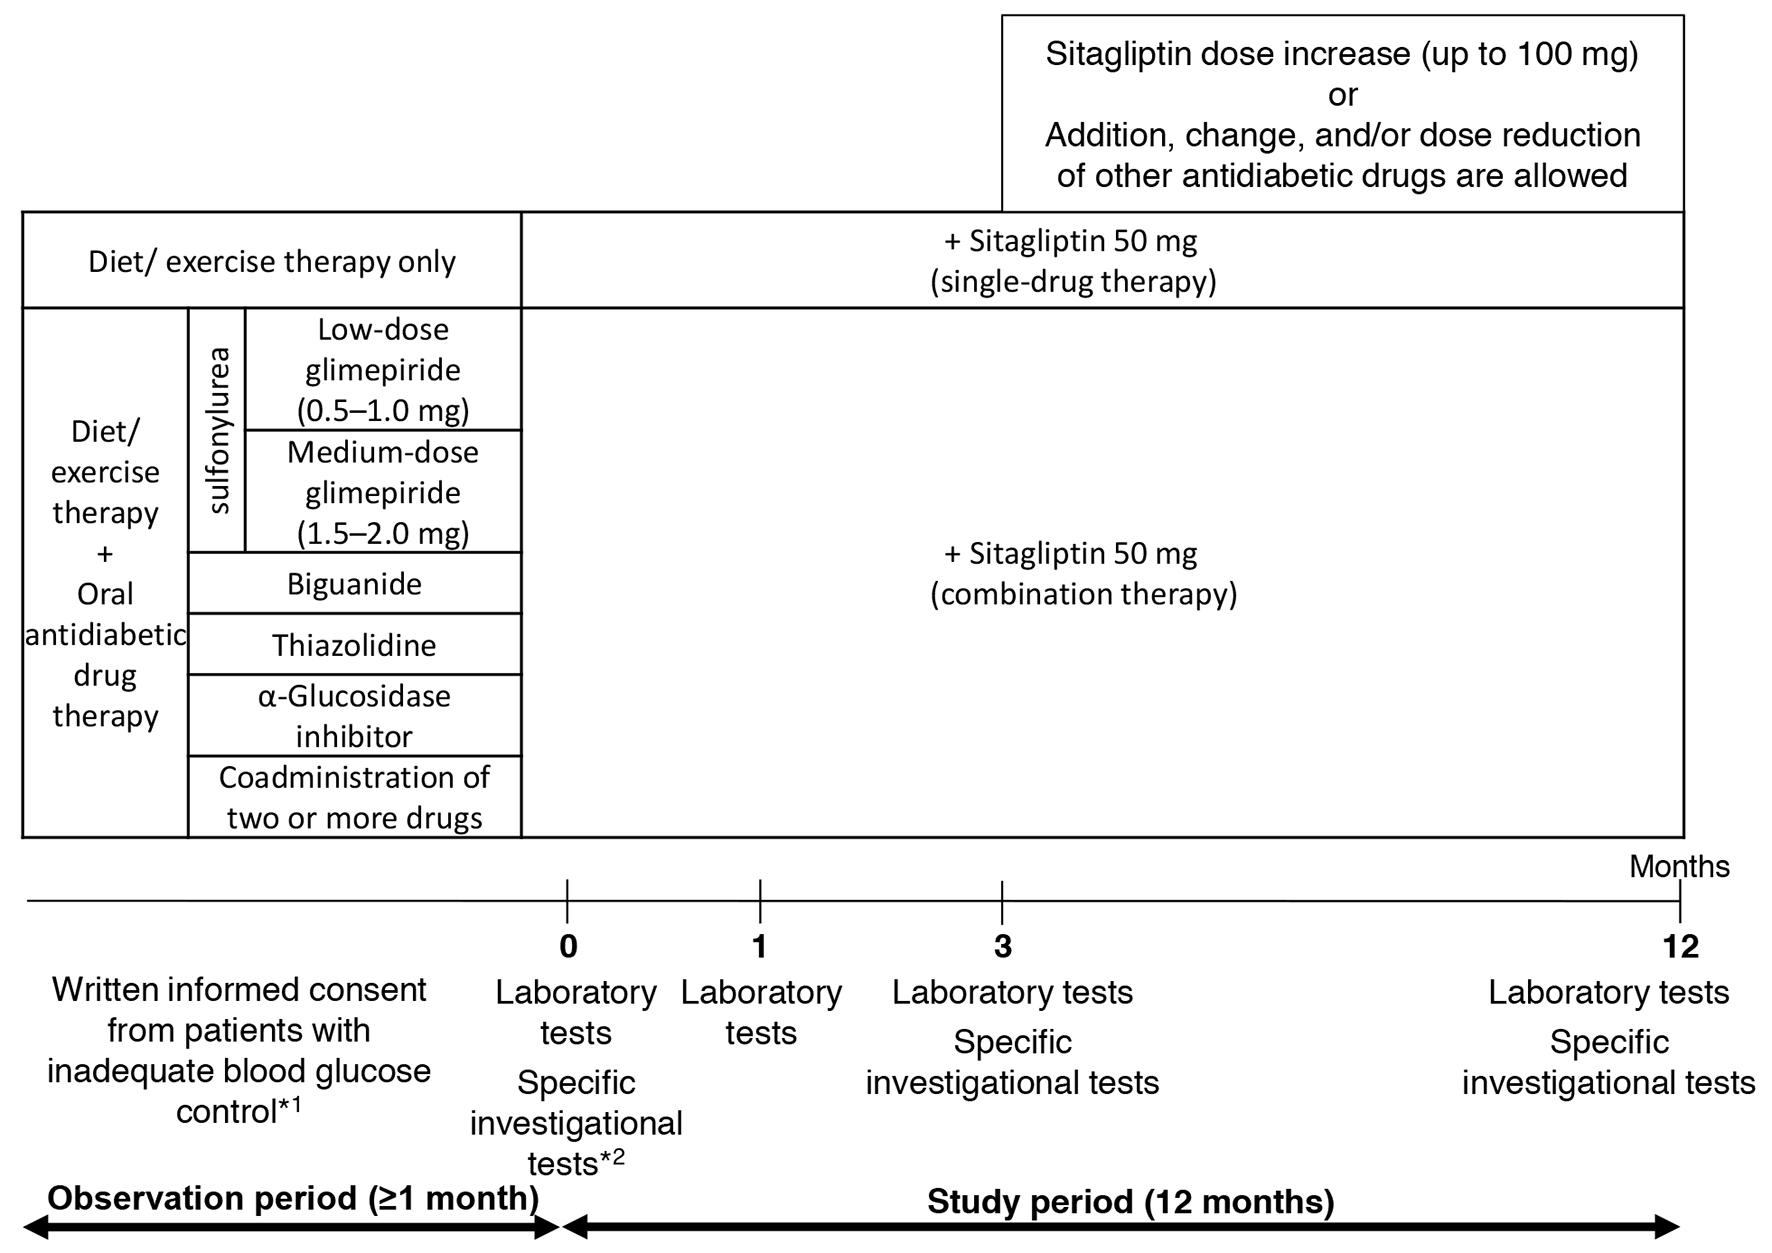
Figure 1. Study design. *1: criteria for inadequate blood glucose control: HbA1c level ≥ 6.9% or fasting blood glucose level ≥ 130 mg/dL. *2: specific investigational tests (optional): GA, 1.5AG, C-peptide, and proinsulin-to-insulin ratio.
| Journal of Clinical Medicine Research, ISSN 1918-3003 print, 1918-3011 online, Open Access |
| Article copyright, the authors; Journal compilation copyright, J Clin Med Res and Elmer Press Inc |
| Journal website http://www.jocmr.org |
Original Article
Volume 10, Number 1, January 2018, pages 32-40
Renal Function During an Open-Label Prospective Observational Trial of Sitagliptin in Patients With Diabetes: A Sub-Analysis of the JAMP Study
Figures
Tables
| Parameter | Mean ± SD or n (%) | Parameter | Mean ± SD or n (%) |
|---|---|---|---|
| Data are represented as the mean ± SD or n (%). BMI: body mass index; T2DM: type 2 diabetes mellitus; HbA1c: glycated hemoglobin; HOMA-IR: homeostatic model assessment for insulin resistance; HOMA-β: homeostatic model assessment for β-cell function; SBP: systolic blood pressure; DBP: diastolic blood pressure; α-GI: α-glucosidase inhibitor. | |||
| Age (years) | 63.8 ± 11.8 | Arteriosclerosis obliterans | 55 (8.4) |
| Sex (male %) | 434 (66.7) | Atrial fibrillation | 16 (2.5) |
| BMI (kg/m2) | 25.2 ± 4.2 | Renal disease | 49 (7.5) |
| Duration of T2DM (years) | 8.8 ± 6.7 | Hepatic disease | 56 (8.6) |
| Abdominal circumference (cm) | 88.3 ± 11.1 | Myocardial infarction | 18 (2.8) |
| HbA1c (%) | 7.86 ± 1.07 | Cerebral stroke | 45 (6.9) |
| Fasting blood glucose (mg/dL) | 159.2 ± 41.5 | Angina pectoris | 27 (4.1) |
| HOMA-IR | 2.83 ± 1.80 | Cardiac failure | 11 (1.7) |
| HOMA-β (%) | 32.1 ± 27.1 | Myocardial infarction | 18 (2.8) |
| C-peptide (ng/mL) | 2.10 ± 0.89 | Diet/exercise therapy | 189 (29) |
| SBP (mm Hg) | 130.9 ± 14.9 | Low-dose glimepiride 0.5 - 1.0 mg | 72 (11.1) |
| DBP (mm Hg) | 76.5 ± 10.5 | Medium-dose glimepiride 1.5 - 2.0 mg | 50 (7.7) |
| Hypertension | 393 (60.4) | Biguanide | 99 (15.2) |
| Dyslipidemia | 417 (64.1) | Thiazolidine | 38 (5.8) |
| Hyperuricemia | 65 (10) | α-GI | 18 (2.8) |
| Retinopathy | 48 (7.4) | Multiple-drug co-administration | 185 (28.4) |
| Independent variables | Single regression analysis | Multiple regression analysis | ||||||
|---|---|---|---|---|---|---|---|---|
| Regression coefficient | Lower limit | Upper limit | P-value | Partial regression coefficient | Lower limit | Upper limit | P-value | |
| T2DM: type 2 diabetes mellitus; ARB: angiotensin II receptor blocker; ACEI: angiotensin converting enzyme inhibitor; HbA1c: glycated hemoglobin; M: month; eGFR: estimated glomerular filtration rate; Δ: change in; UACR: urinary albumin-to-creatinine ratio. ‡P < 0.05 single regression analysis. §P < 0.05 multiple regression analysis. | ||||||||
| Age | -0.008 | -0.072 | 0.056 | 0.802 | ||||
| Sex (male) | 0.682 | -0.915 | 2.279 | 0.402 | ||||
| Duration of T2DM | -0.003 | -0.012 | 0.006 | 0.512 | ||||
| Anti-hypertensive | -1.017 | -2.524 | 0.490 | 0.185 | -1.519 | -3.545 | 0.506 | 0.141 |
| With ARB or ACEI | -0.615 | -2.132 | 0.901 | 0.426 | ||||
| HbA1c_0M | -0.358 | -1.072 | 0.356 | 0.325 | ||||
| eGFR_0M | -0.135 | -0.174 | -0.097 | > 0.001‡ | -0.130 | -0.189 | -0.072 | > 0.001§ |
| SBP_0M | -0.016 | -0.067 | 0.035 | 0.539 | ||||
| ΔHbA1c_3M | 1.215 | 0.278 | 2.153 | 0.011‡ | 0.867 | -0.518 | 2.251 | 0.218 |
| ΔSBP_3M | -0.035 | -0.086 | 0.016 | 0.182 | -0.024 | -0.094 | 0.046 | 0.506 |
| ΔUACR_3M | 0.005 | > 0.001 | 0.011 | 0.046‡ | 0.005 | 0.000 | 0.010 | 0.040§ |