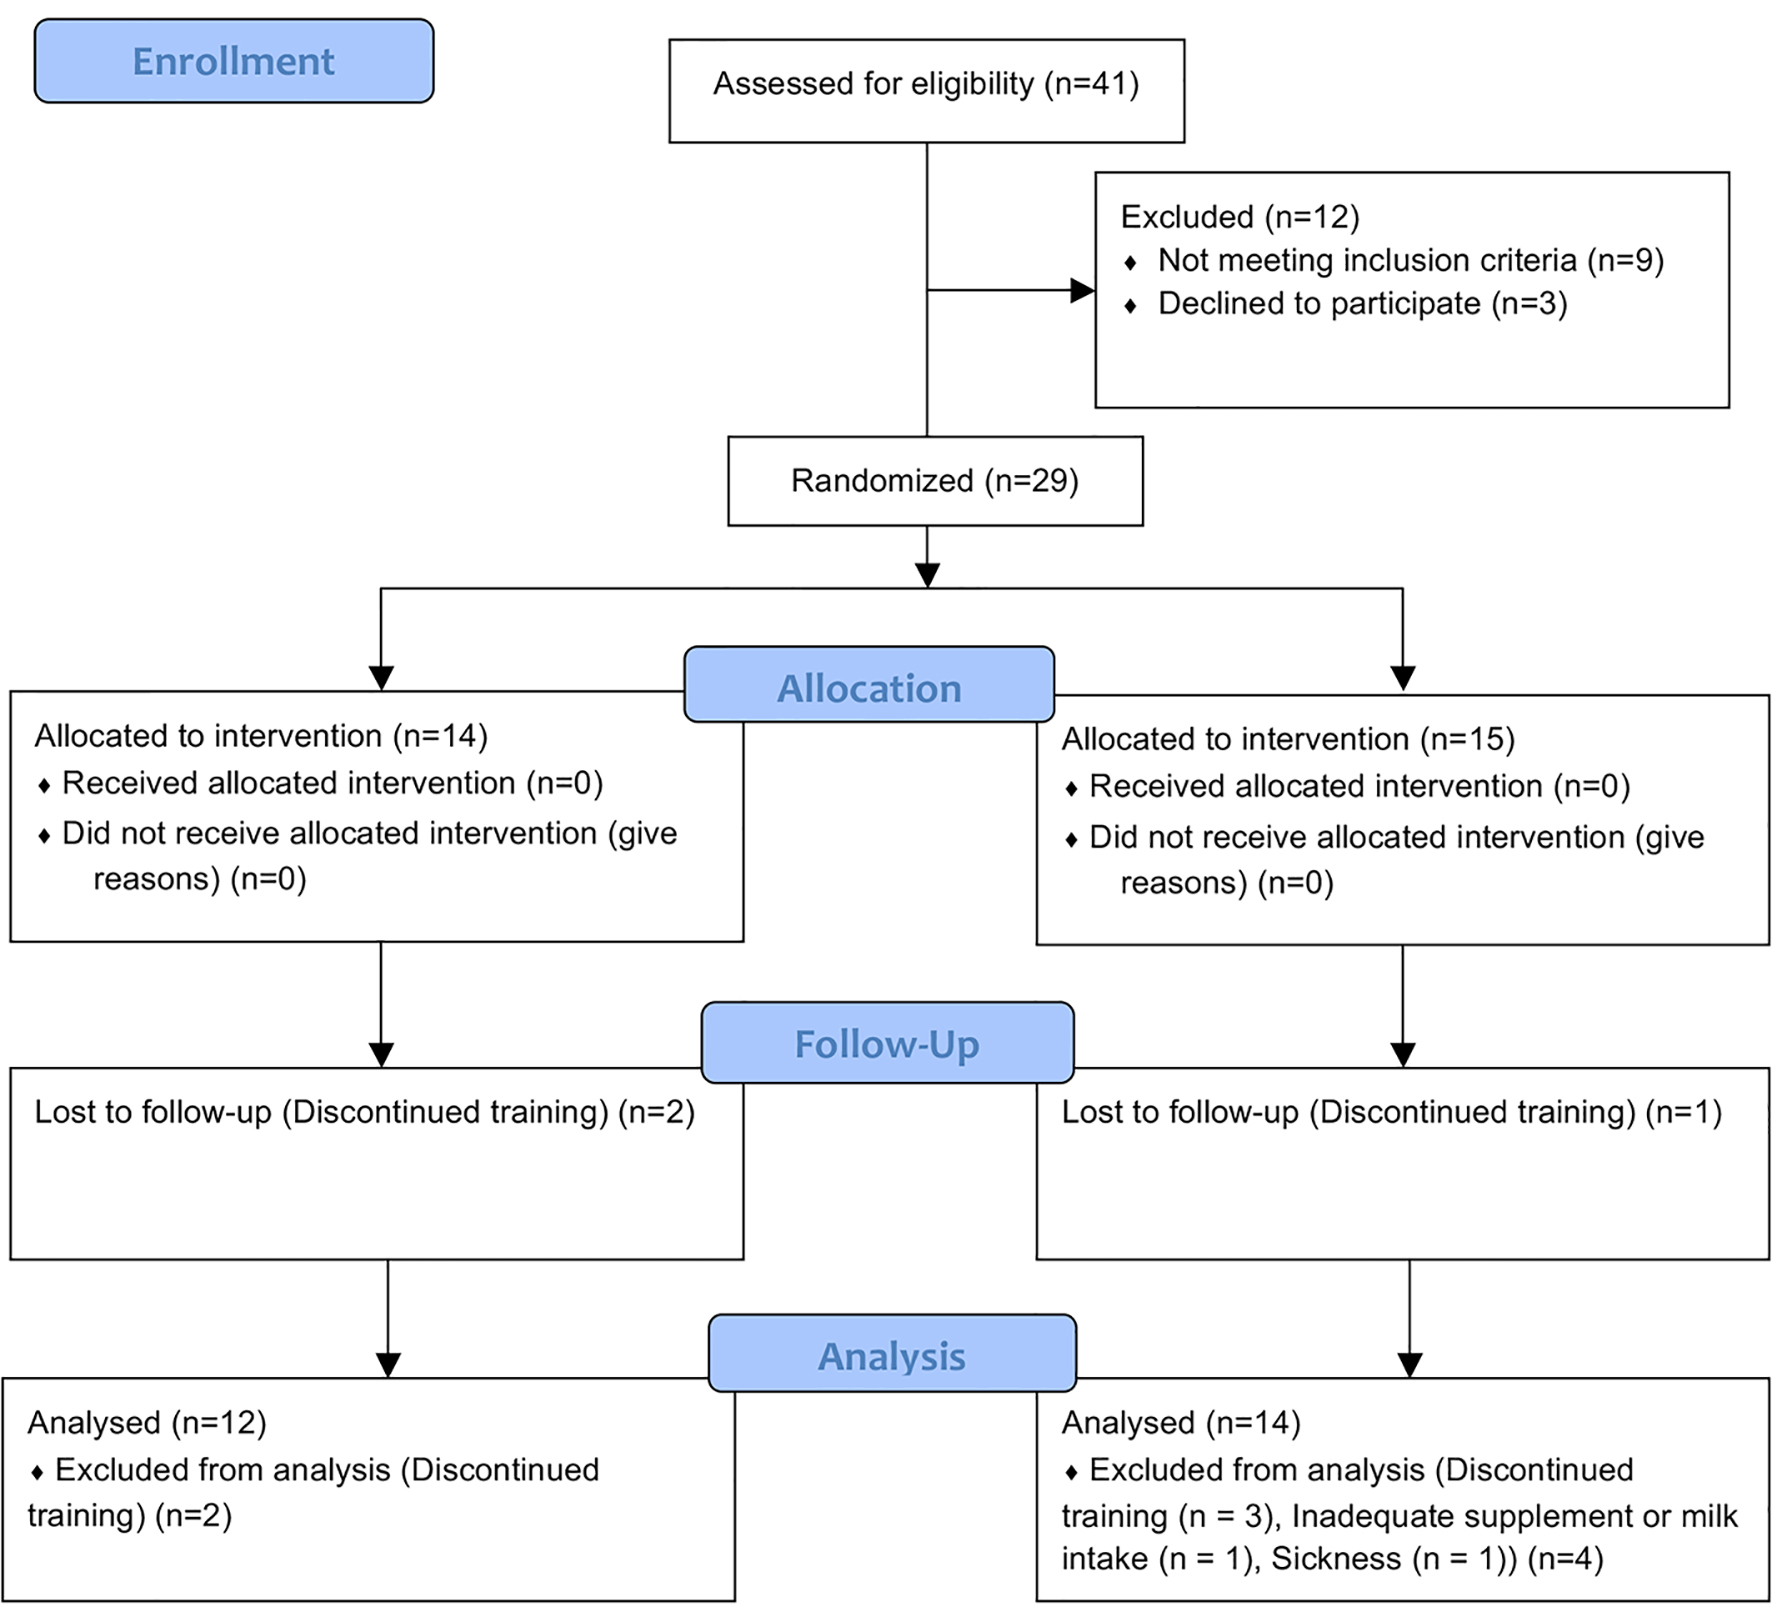
Figure 1. Study flow diagram.
| Journal of Clinical Medicine Research, ISSN 1918-3003 print, 1918-3011 online, Open Access |
| Article copyright, the authors; Journal compilation copyright, J Clin Med Res and Elmer Press Inc |
| Journal website http://www.jocmr.org |
Original Article
Volume 10, Number 1, January 2018, pages 13-21
The Effect of Ongoing Vitamin D and Low-Fat Milk Intake on Bone Metabolism in Female High-School Endurance Runners
Figure
Tables
| Group | Baseline | 3 months | 6 months | P | |||
|---|---|---|---|---|---|---|---|
| Time | Group | Time × group | |||||
| Values are represented as mean ± SD. Differences in time (baseline, 3 months, and 6 months) and group (MKD and CON) were evaluated with repeated two-way ANOVAs for subject characteristics. Because fat mass and fat-free mass (FFM) were measured in before and after the 6-month trial period only, the values in 3 months were not measured (-). MKD: vitamin D supplement + low-fat milk group; CON: control group. | |||||||
| Height (cm) | MKD | 158.9 ± 4.2 | 159.0 ± 4.4 | 159.3 ± 4.3 | < 0.01 | n.s | n.s |
| CON | 158.3 ± 5.0 | 158.5 ± 5.0 | 158.9 ± 5.0 | ||||
| Weight (kg) | MKD | 47.3 ± 3.3 | 48.5 ± 2.8 | 49.3 ± 2.8 | < 0.01 | n.s | n.s |
| CON | 45.3 ± 3.2 | 46.8 ± 3.2 | 47.6 ± 3.6 | ||||
| BMI (kg/m2) | MKD | 18.7 ± 1.5 | 19.2 ± 1.4 | 19.5 ± 1.3 | < 0.01 | n.s | n.s |
| CON | 18.1 ± 1.1 | 18.7 ± 1.5 | 18.9 ± 1.7 | ||||
| Fat mass (%) | MKD | 19.6 ± 5.3 | - | 21.8 ± 5.2 | < 0.01 | n.s | n.s |
| CON | 17.9 ± 4.8 | - | 21.0 ± 5.6 | ||||
| Appendicular FFM (kg) | MKD | 16.1 ± 1.3 | - | 16.6 ± 1.4 | < 0.01 | n.s | n.s |
| CON | 15.7 ± 1.3 | - | 16.1 ± 1.2 | ||||
| Running distance (km/month) | MKD | 187.8 ± 88.3 | 215.5 ± 117.7 | 179.4 ± 85.2 | n.s | 0.03 | n.s |
| CON | 124.5 ± 70.7 | 103.9 ± 73.9 | 106.7 ± 61.0 | ||||
| Frequency of menses (time/year) | MKD | 11.1 ± 2.2 | 11.8 ± 3.3 | 12.5 ± 2.9 | n.s | 0.04 | n.s |
| CON | 6.8 ± 5.3 | 8.2 ± 5.7 | 7.7 ± 5.1 | ||||
| Group | Baseline | 6 months | P | |||
|---|---|---|---|---|---|---|
| Time | Group | Time × group | ||||
| Values are represented as mean ± SD. Differences in time (baseline, 3 months, and 6 months) and group (MKD and CON) were evaluated with repeated two-way ANOVAs for BMD. TBLH: total bone less head; MKD: vitamin D supplement + low-fat milk group; CON: control group. | ||||||
| Arms BMD (g/cm2) | MKD | 0.838 ± 0.063 | 0.858 ± 0.051 | < 0.01 | n.s | n.s |
| CON | 0.818 ± 0.061 | 0.828 ± 0.051 | ||||
| Legs BMD (g/cm2) | MKD | 1.217 ± 0.064 | 1.230 ± 0.061 | < 0.01 | n.s | n.s |
| CON | 1.199 ± 0.077 | 1.212 ± 0.072 | ||||
| Pelvic BMD (g/cm2) | MKD | 1.068 ± 0.082 | 1.086 ± 0.076 | < 0.01 | n.s | n.s |
| CON | 1.051 ± 0.079 | 1.077 ± 0.075 | ||||
| Spine BMD (g/cm2) | MKD | 0.967 ± 0.093 | 0.999 ± 0.098 | < 0.01 | n.s | n.s |
| CON | 0.981 ± 0.073 | 1.014 ± 0.069 | ||||
| TBLH BMD (g/cm2) | MKD | 0.992 ± 0.054 | 1.002 ± 0.050 | < 0.01 | n.s | n.s |
| CON | 0.978 ± 0.059 | 0.991 ± 0.050 | ||||
| Group | Baseline | 3 months | 6 months | P | |||
|---|---|---|---|---|---|---|---|
| Time | Group | Time × group | |||||
| Values are represented as mean ± SD. Differences in time (baseline, 3 months, and 6 months) and group (MKD and CON) were evaluated with repeated two-way ANOVAs for biomarkers. *P < 0.05 vs. CON, †P < 0.05, ††P < 0.01 vs. Baseline. BAP/CTX: bone formation to resorption ratio; MKD: vitamin D supplement + low-fat milk group; CON: control group. | |||||||
| 25(OH)D (ng/mL) | MKD | 31.8 ± 6.5 | 31.8 ± 5.0 | 30.2 ± 3.8 | < 0.01 | n.s | < 0.01 |
| CON | 34.7 ± 8.2 | 28.0 ± 7.1†† | 27.9 ± 5.3†† | ||||
| PTH (pg/mL) | MKD | 33.9 ± 10.0 | 29.2 ± 7.3 | 36.9 ± 11.2 | < 0.01 | n.s | 0.06 |
| CON | 30.0 ± 8.5 | 32.0 ± 6.6 | 40.5 ± 8.7 | ||||
| TNF-α (pg/mL) | MKD | 1.08 ± 0.28* | 0.87 ± 0.26 | 0.83 ± 0.30† | n.s | n.s | 0.04 |
| CON | 0.71 ± 0.38 | 0.85 ± 0.29 | 0.71 ± 0.34 | ||||
| CTX (ng/mL) | MKD | 0.66 ± 0.19 | 0.54 ± 0.18 | 0.55 ± 0.18 | 0.04 | n.s | n.s |
| CON | 0.85 ± 0.23 | 0.70 ± 0.25 | 0.76 ± 0.48 | ||||
| BAP (µg/L) | MKD | 15.7 ± 5.5 | 15.3 ± 4.1 | 16.1 ± 3.3 | n.s | n.s | n.s |
| CON | 17.5 ± 9.5 | 17.7 ± 11.1 | 18.2 ± 10.8 | ||||
| BAP/CTX | MKD | 24.8 ± 10.4 | 31.9 ± 17.6 | 33.5 ± 16.4 | < 0.01 | n.s | n.s |
| CON | 20.2 ± 7.3 | 24.7 ± 7.4 | 24.8 ± 6.8 | ||||
| Baseline to 3 months | Baseline to 6 months | |||||
|---|---|---|---|---|---|---|
| CON (n = 10) | MKD (n = 10) | P | CON (n = 10) | MKD (n = 10) | P | |
| Values are represented as mean ± SE. The change in concentration of each biomarker in both groups was compared after each biomarker was adjusted for Baseline values, frequency of menses, and running distance, respectively. Model 1: baseline value. Model 2: baseline value, frequency of menses (baseline value). Model 3: baseline value, frequency of menses (baseline value), running distance (baseline value). MKD: vitamin D supplement + low-fat milk group; CON: control group. | ||||||
| 25(OH)D (ng/mL) | ||||||
| Model 1 | -6.33 ± 0.76 | -0.32 ± 0.76 | < 0.01 | -6.12 ± 0.78 | -2.21 ± 0.78 | < 0.01 |
| Model 2 | -6.17 ± 0.83 | -0.48 ± 0.83 | < 0.01 | -5.87 ± 0.85 | -2.45 ± 0.85 | 0.02 |
| Model 3 | -6.19 ± 0.96 | -0.46 ± 0.96 | < 0.01 | -5.46 ± 0.95 | -2.87 ± 0.95 | 0.11 |
| PTH (pg/mL) | ||||||
| Model 1 | 1.17 ± 1.50 | -3.87 ± 1.50 | 0.03 | 9.91 ± 2.53 | 3.59 ± 2.53 | 0.10 |
| Model 2 | 2.01 ± 1.53 | -4.71 ± 1.53 | 0.01 | 9.67 ± 2.77 | 3.83 ± 2.77 | 0.18 |
| Model 3 | 1.63 ± 1.65 | -4.33 ± 1.65 | 0.04 | 7.32 ± 2.43 | 6.18± 2.43 | 0.77 |
| TNF-α (pg/mL) | ||||||
| Model 1 | 0.03 ± 0.08 | -0.11 ± 0.08 | 0.25 | -0.07 ± 0.08 | -0.19 ± 0.08 | 0.36 |
| Model 2 | 0.04 ± 0.10 | -0.12 ± 0.10 | 0.35 | -0.10 ± 0.10 | -0.16 ± 0.10 | 0.71 |
| Model 3 | -0.03 ± 0.08 | -0.05 ± 0.08 | 0.94 | -0.10 ± 0.11 | -0.16 ± 0.11 | 0.77 |
| CTX (ng/mL) | ||||||
| Model 1 | -0.13 ± 0.04 | -0.13 ± 0.04 | 0.95 | -0.10 ± 0.09 | -0.09 ± 0.09 | 0.92 |
| Model 2 | -0.15 ± 0.04 | -0.12 ± 0.04 | 0.60 | -0.14 ± 0.09 | -0.05 ± 0.09 | 0.50 |
| Model 3 | -0.14 ± 0.04 | -0.13 ± 0.04 | 0.86 | -0.15 ± 0.09 | -0.04 ± 0.09 | 0.44 |
| BAP (µg/L) | ||||||
| Model 1 | 0.31 ± 1.58 | -0.53 ± 1.58 | 0.71 | 0.85 ± 1.39 | 0.33 ± 1.39 | 0.80 |
| Model 2 | -0.18 ± 1.72 | -0.04 ± 1.72 | 0.96 | 0.90 ± 1.54 | 0.29 ± 1.54 | 0.80 |
| Model 3 | 0.25 ± 2.01 | -0.47 ± 1.96 | 0.82 | 1.05 ± 1.77 | 0.13 ± 1.77 | 0.75 |
| CTX (ng/mL) | BAP/CTX | |||||||||||
|---|---|---|---|---|---|---|---|---|---|---|---|---|
| Baseline | 3 months | 6 months | Baseline | 3 months | 6 months | |||||||
| r | P | r | P | r | P | r | P | r | P | r | P | |
| Pooled analysis by partial correlation coefficient. Values are r and P values. | ||||||||||||
| 25(OH)D (ng/mL) | ||||||||||||
| Baseline | -0.61 | < 0.01 | - | - | - | - | 0.31 | 0.19 | - | - | - | - |
| 3 months | - | - | -0.54 | 0.02 | - | - | - | - | 0.59 | 0.01 | - | - |
| 6 months | - | - | - | - | -0.53 | 0.02 | - | - | - | - | 0.56 | 0.01 |
| PTH (pg/mL) | ||||||||||||
| Baseline | 0.20 | 0.42 | - | - | - | - | -0.16 | 0.50 | - | - | - | - |
| 3 months | - | - | 0.63 | < 0.01 | - | - | - | - | -0.59 | 0.01 | - | - |
| 6 months | - | - | - | - | 0.52 | 0.02 | - | - | - | - | -0.58 | < 0.01 |