Journal of Clinical Medicine Research, ISSN 1918-3003 print, 1918-3011 online, Open Access
Article copyright, the authors; Journal compilation copyright, J Clin Med Res and Elmer Press Inc
Journal website http://www.jocmr.org

Original Article

Volume 9, Number 11, November 2017, pages 917-925


Body Composition Is Altered in Pre-Diabetic Patients With Impaired Fasting Glucose Tolerance: Results From the NHANES Survey

Figures

Figure 1.
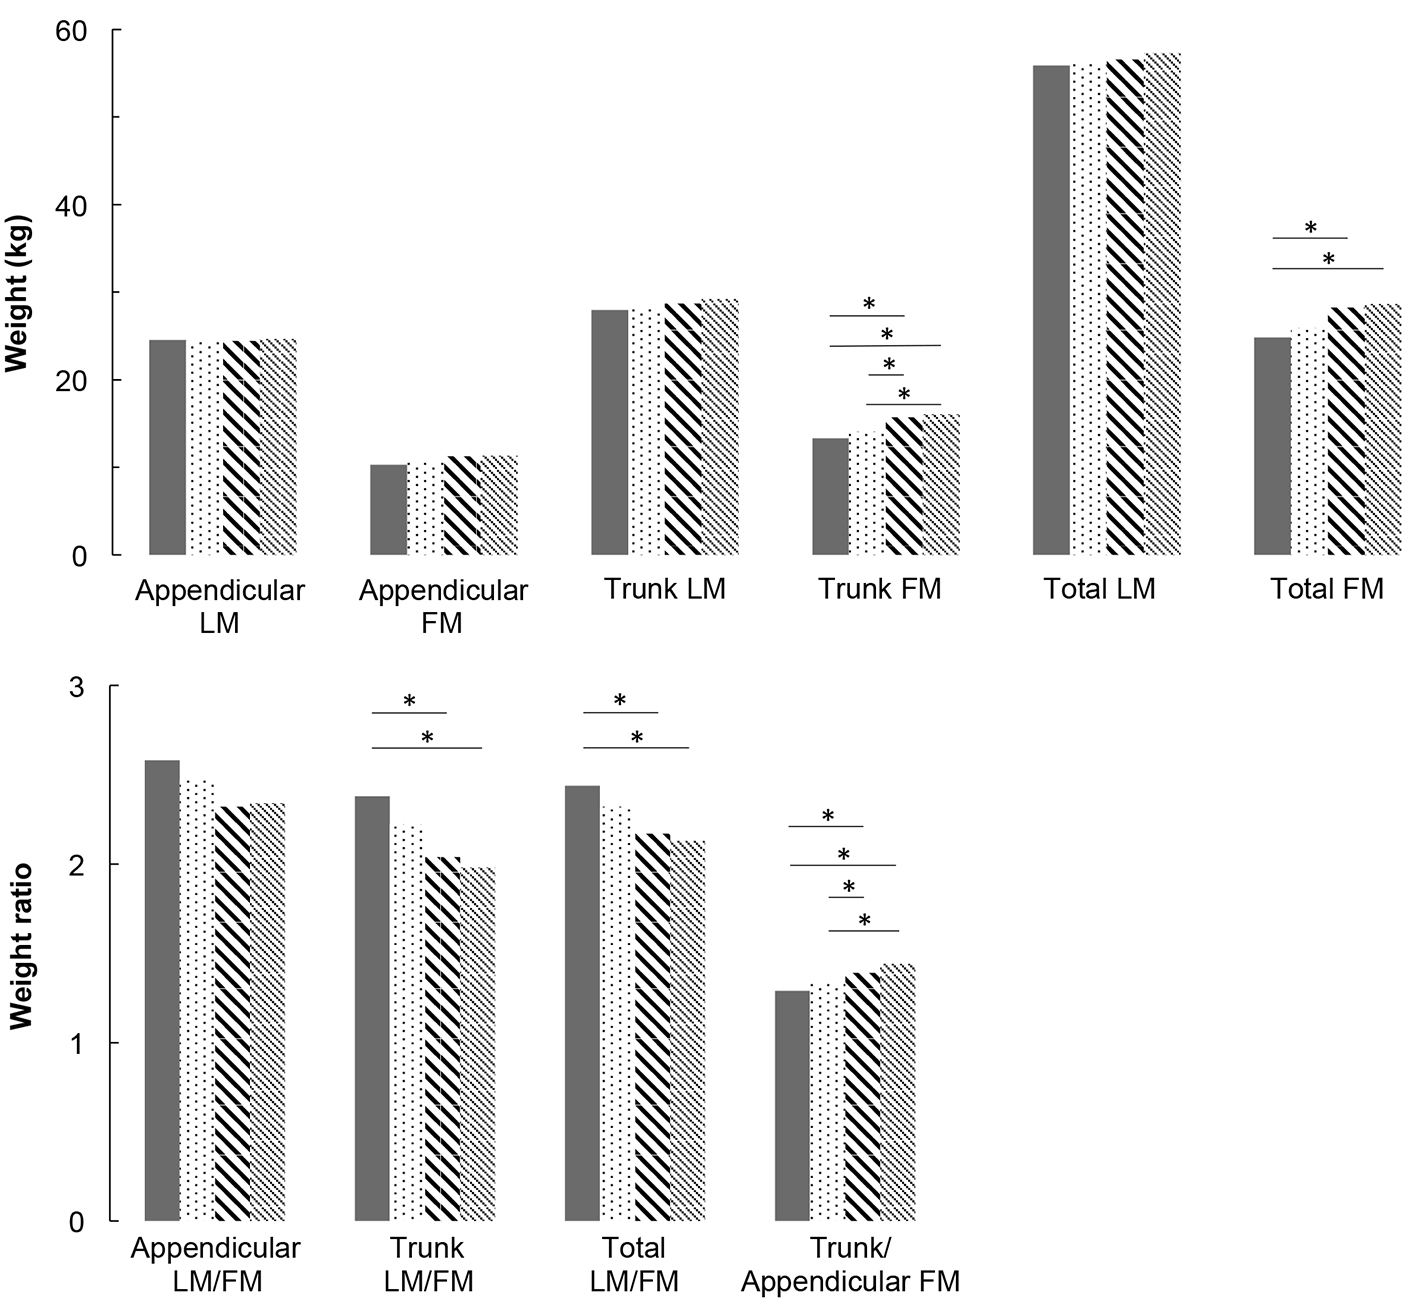
Figure 1. Lean mass and fat mass distribution adjusted for covariates (age, height, weight, ethnicity, physical activity, smoking and alcohol consumption) for men. * means that groups are significantly different from each other by a Tukey-Kramer pairwise comparison (P < 0.05).
Figure 2.
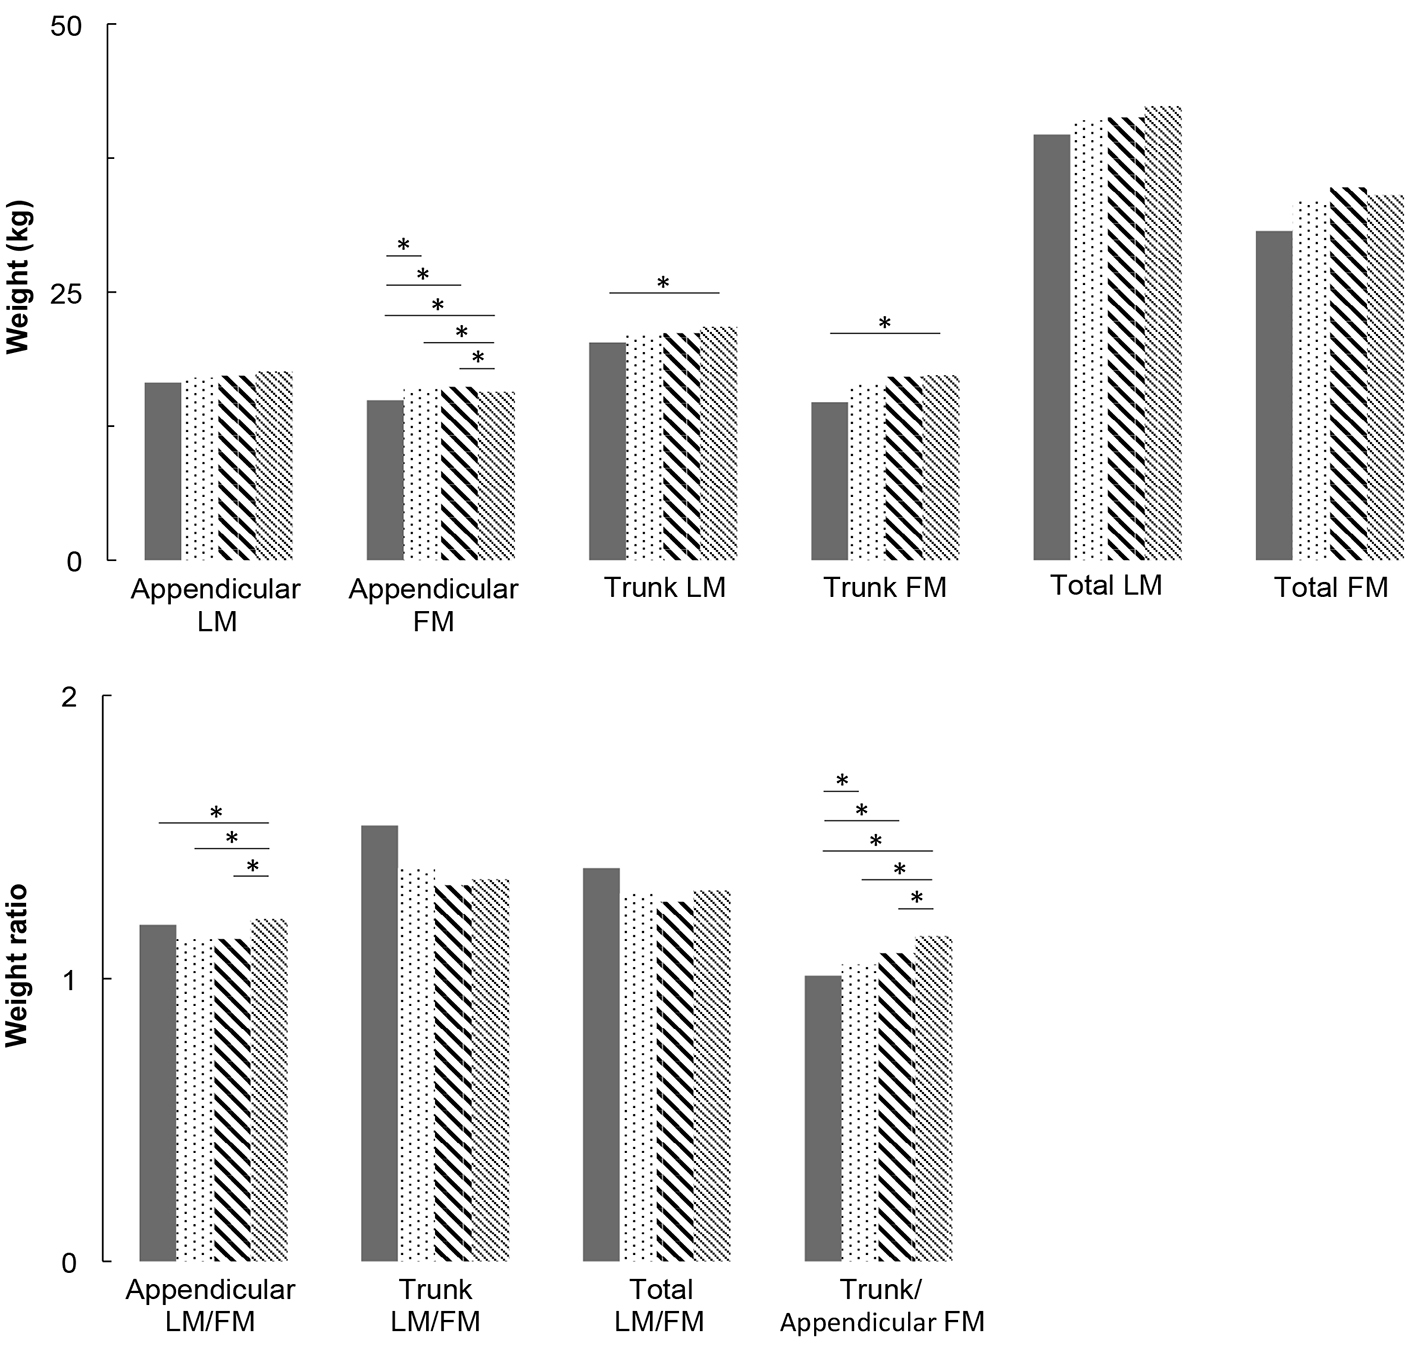
Figure 2. Lean mass and fat mass distribution adjusted for covariates (age, height, weight, ethnicity, physical activity, smoking and alcohol consumption) for women. * means that groups are significantly different from each other by a Tukey-Kramer pairwise comparison (P < 0.05).

Tables

Table 1. Characteristics of All Participants in Men
 
MenNGT (n = 1,223)Low IFG (n = 330)High IFG (n = 228)T2DM (n = 130)P-value
Data are mean with standard deviation or n with percentage in brackets. Groups marked with different letters (a, b, c, d) are significantly different from each other by a Tukey-Kramer pairwise comparison (P < 0.05). Groups marked with the same letters are not significantly different from each other. WC: waist circumference; FBG: fasting blood glucose; PA: physical activity; HOMA-IR: homeostasis model assessment of insulin resistance; CRP: C-reactive protein.
Age (years)63.0 ± 11.9b64.9 ± 12.0a66.7 ± 11.5a64.8 ± 10.3a,b< 0.0001
Height (cm)173.4 ± 7.6173.4 ± 7.6173.0 ± 7.4172.7 ± 7.5NS
Weight (kg)83.3 ± 16.0c84.5 ± 16.1b,c87.4 ± 19.3b88.5 ± 18.0a< 0.0001
Body mass index (kg/m2)27.6 ± 4.5c28.0 ± 4.5c29.1 ± 5.7b29.7 ± 5.6a< 0.0001
Waist circumference (cm)100.6 ± 12.2c102.3 ± 12.1b105.4 ± 14.2a106.4 ± 12.5a< 0.0001
Fasting blood glucose (mmol/L)5.03 ± 0.4d5.81 ± 0.1c6.4 ± 0.3b9.3 ± 2.4a< 0.0001
HbA1c (%)5.42 ± 0.4d5.6 ± 0.5c5.8 ± 0.6b7.5 ± 2.0a< 0.0001
Alcohol (g/day)11.6 ± 25.4a10.8 ± 22.6a13.3 ± 29.3a5.7 ± 15.2b0.0002
Physical activity (PA) (h/day)
  Low intensity PA (h/day)2.8 ± 1.62.8 ± 1.62.8 ± 1.82.9 ± 1.6NS
  Moderate intensity PA (h/day)0.6 ± 1.20.5 ± 1.10.6 ± 1.20.6 ± 1.3NS
  Vigorous intensity PA (h/day)0.1 ± 0.40.1 ± 0.30.1 ± 0.20.1 ± 0.5NS
Ethnicity, n (%)
  Hispanic and other325 (26.5)99 (30.0)63 (27.6)45 (34.6)0.002
  Non-Hispanic White707 (57.8)197 (59.7)130 (57.0)64 (49.2)0.001
  Non-Hispanic Black191 (15.7)34 (10.3)35 (15.4)21 (16.2)0.005
Smoking status, n (%)
  Current smoker244 (20.0)52 (15.8)32 (14.0)19 (14.6)0.021
  Occasionally30 (2.5)8 (2.4)7 (3.1)5 (3.8)NS
  Never smoker949 (77.5)270 (81.8)189 (82.9)106 (81.6)NS
Insulin (µU/mL)9.2 ± 6.8c12.0 ± 7.7c14.9 ± 10.3b20.1 ± 17.4a< 0.0001
HOMA-IR2.1 ± 1.6c3.1 ± 2.0c4.3 ± 3.1b8.0 ± 7.1a< 0.0001
CRP (mg/dL)0.4 ± 0.70.5 ± 1.10.6 ± 1.20.6 ± 1.4NS


Table 2. Characteristics of All Participants in Women
 
WomenNGT (n = 1,448)Low IFG (n = 296)High IFG (n = 139)T2DM (n = 94)P-value
Data are mean with standard deviation or n with percentage in brackets. Groups marked with different letters (a, b, c, d) are significantly different from each other by a Tukey-Kramer pairwise comparison (P < 0.05). Groups marked with the same letters are not significantly different from each other. WC: waist circumference; FBG: fasting blood glucose; PA: physical activity; HOMA-IR: homeostasis model assessment of insulin resistance; CRP: C-reactive protein.
Age (years)62.8 ± 12.1b65.6 ± 12.1a67.0 ± 11.8a66.6 ± 10.3a< 0.0001
Height (cm)159.8 ± 7.0159.7 ± 6.5158.3 ± 7.6159.2 ± 7.5NS
Weight (kg)72.4 ± 16.7c76.5 ± 17.7b77.5 ± 18.0a,b78.4 ± 18.0a< 0.0001
Body mass index (kg/m2)28.3 ± 6.0c29.9 ± 6.3b30.8 ± 6.3a30.8 ± 5.6a< 0.0001
Waist circumference (cm)94.1 ± 13.6c98.9 ± 13.5b101.7 ± 13.2a103.1 ± 12.5a< 0.0001
Fasting blood glucose (mmol/L)5.0 ± 0.4d5.80 ± 0.1c6.44 ± 0.3b9.4 ± 2.7a< 0.0001
HbA1c (%)5.4 ± 0.3d5.6 ± 0.4c5.9 ± 0.5b7.4 ± 2.0a< 0.0001
Alcohol (g/day)3.6 ± 12.13.9 ± 13.23.8 ± 15.15.1 ± 18.9NS
Physical activity (PA) (h/day)
  Low intensity PA (h/day)2.8 ± 1.6b3.0 ± 1.6b3.0 ± 1.6b2.9 ± 1.6a< 0.0001
  Moderate intensity PA (h/day)0.5 ± 0.9a0.4 ± 0.8a0.4 ± 1.0a0.6 ± 1.3b< 0.01
  Vigorous intensity PA (h/day)0.08 ± 0.27a0.1 ± 0.3b0.03 ± 0.14b,c0.02 ± 0.07c< 0.05
Ethnicity, n (%)
  Hispanic and other398 (27.5)77 (26.0)51 (36.7)31 (33.0)< 0.0001
  Non-Hispanic White827 (57.1)171 (57.8)64 (46.0)37 (39.3)< 0.0001
  Non-Hispanic Black223 (15.4)48 (16.2)24 (17.3)26 (27.7)0.001
Smoking status, n (%)
  Current smoker186 (12.9)52 (15.8)32 (14.0)19 (14.6)NS
  Occasionally27 (1.9)8 (2.4)7 (3.1)5 (3.8)NS
  Never smoker1235 (85.2)270 (81.8)189 (82.9)106 (81.6)NS
Insulin (µU/mL)9.2 ± 6.8c13.9 ± 8.8b16.0 ± 9.0b21.9 ± 17.0a< 0.0001
HOMA-IR2.1 ± 1.6c3.6 ± 2.3b4.6 ± 2.6b9.2 ± 7.8a< 0.0001
CRP (mg/dL)0.4 ± 0.7b0.6 ± 0.8b0.7 ± 0.9a,b0.8 ± 0.9a,b< 0.01


Table 3. Fat Mass and Lean Mass Distribution for Each Group, Non-Adjusted for Covariates
 
NGTLow IFGHigh IFGT2DM
Data are mean with standard deviation, non-adjusted for covariates. Groups marked with different letters (a, b, c) are significantly different from each other by a Tukey-Kramer pairwise comparison (P < 0.05). Groups marked with the same letters are not significantly different from each other. LM: lean mass; FM: fat mass.
Men
  Appendicular LM (kg)24.6 ± 4.4a24.4 ± 4.4a24.4 ± 5.1a24.6 ± 5.0a
  Appendicular FM (kg)10.3 ± 3.5b10.6 ± 3.6a,b11.3 ± 4.0a11.3 ± 3.9a
  Trunk LM (kg)27.9 ± 4.4b28.3 ± 4.3a,b28.7 ± 5.1a,b29.2 ± 4.9a
  Trunk FM (kg)13.3 ± 5.1b14.1 ± 5.2b15.7 ± 6.0a16.1 ± 5.5a
  Total LM (kg)55.9 ± 8.8a56.1 ± 8.8a56.6 ± 10.3a57.3 ± 9.8a
  Total FM (kg)24.8 ± 8.4b25.9 ± 8.6b28.2 ± 9.9a28.6 ± 9.1a
  Trunk/appendicular FM1.3 ± 0.3b1.3 ± 0.2b1.4 ± 0.3a1.4 ± 0.3a
  Appendicular LM/FM2.6 ± 0.7a2.5 ± 0.6a,b2.3 ± 0.6b2.3 ± 0.6b
  Trunk LM/FM2.4 ± 0.9a2.2 ± 0.7b2.0 ± 0.8b2.0 ± 0.6c
  Total LM/FM2.4 ± 0.7a2.3 ± 0.6a,b2.2 ± 0.6b2.1 ± 0.5b
Women
  Appendicular LM (kg)16.6 ± 3.6b17.0 ± 3.7a17.22 ± 3.9a17.6 ± 4.4a
  Appendicular FM (kg)14.9 ± 5.4b16.0 ± 5.6a16.20 ± 5.8a15.7 ± 6.2a,b
  Trunk LM (kg)20.3 ± 3.3b21.1 ± 3.5a21.20 ± 3.6a21.8 ± 3.6a
  Trunk FM (kg)14.7 ± 5.7b16.5 ± 5.9a17.13 ± 5.6a17.3 ± 5.6a
  Total LM (kg)39.7 ± 6.8b41.0 ± 7.3a41.29 ± 7.6a42.4 ± 8.0a
  Total FM (kg)30.7 ± 10.6b33.6 ± 11.1a34.78 ± 11.0a34.1 ± 11.2a
  Trunk/appendicular FM1.0 ± 0.2c1.0 ± 0.2b1.09 ± 0.2a,b1.1 ± 0.3a
  Appendicular LM/FM1.2 ± 0.3a1.1 ± 0.3b1.14 ± 0.3a,b1.2± 0.3a
  Trunk LM/FM1.5 ± 0.6a1.4 ± 0.4b1.33 ± 0.4b1.3 ± 0.3b
  Total LM/FM1.4 ± 0.4a1.3 ± 0.3b1.27 ± 0.3b1.3 ± 0.3a,b