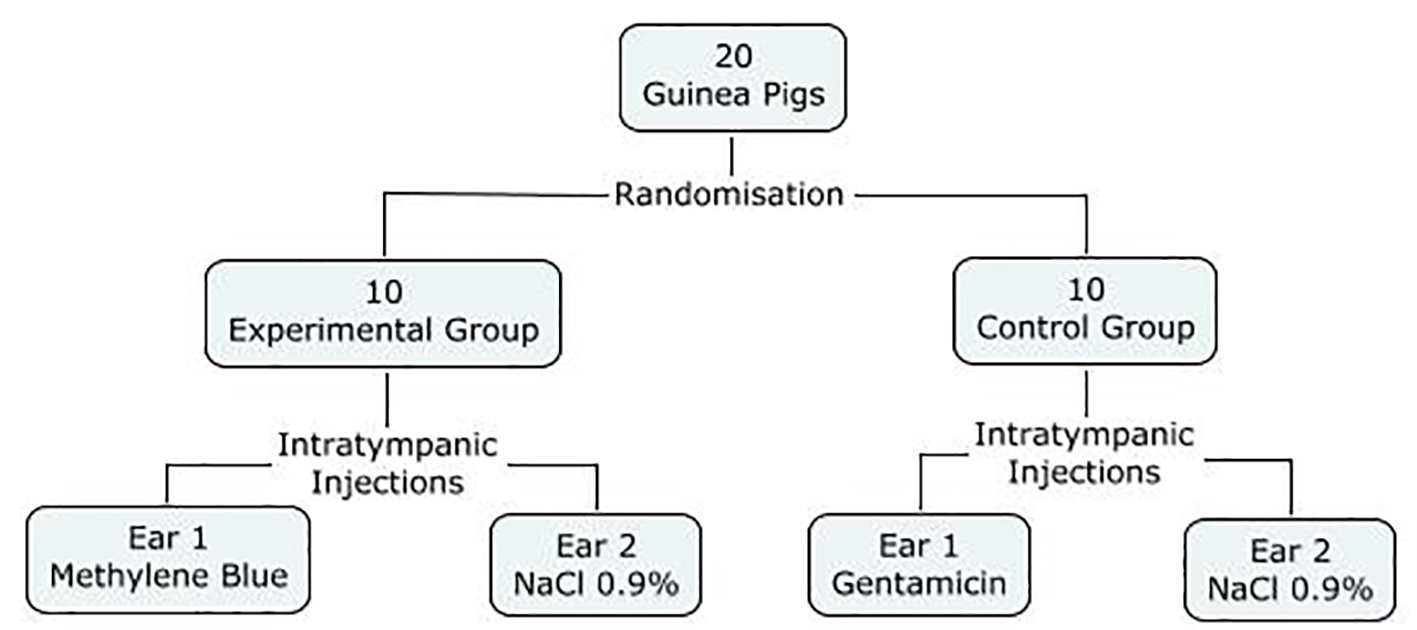
Figure 1. Study design.
| Journal of Clinical Medicine Research, ISSN 1918-3003 print, 1918-3011 online, Open Access |
| Article copyright, the authors; Journal compilation copyright, J Clin Med Res and Elmer Press Inc |
| Journal website http://www.jocmr.org |
Original Article
Volume 9, Number 11, November 2017, pages 900-906
Study of Methylene Blue Ototoxicity in the Guinea Pig
Figures
Tables
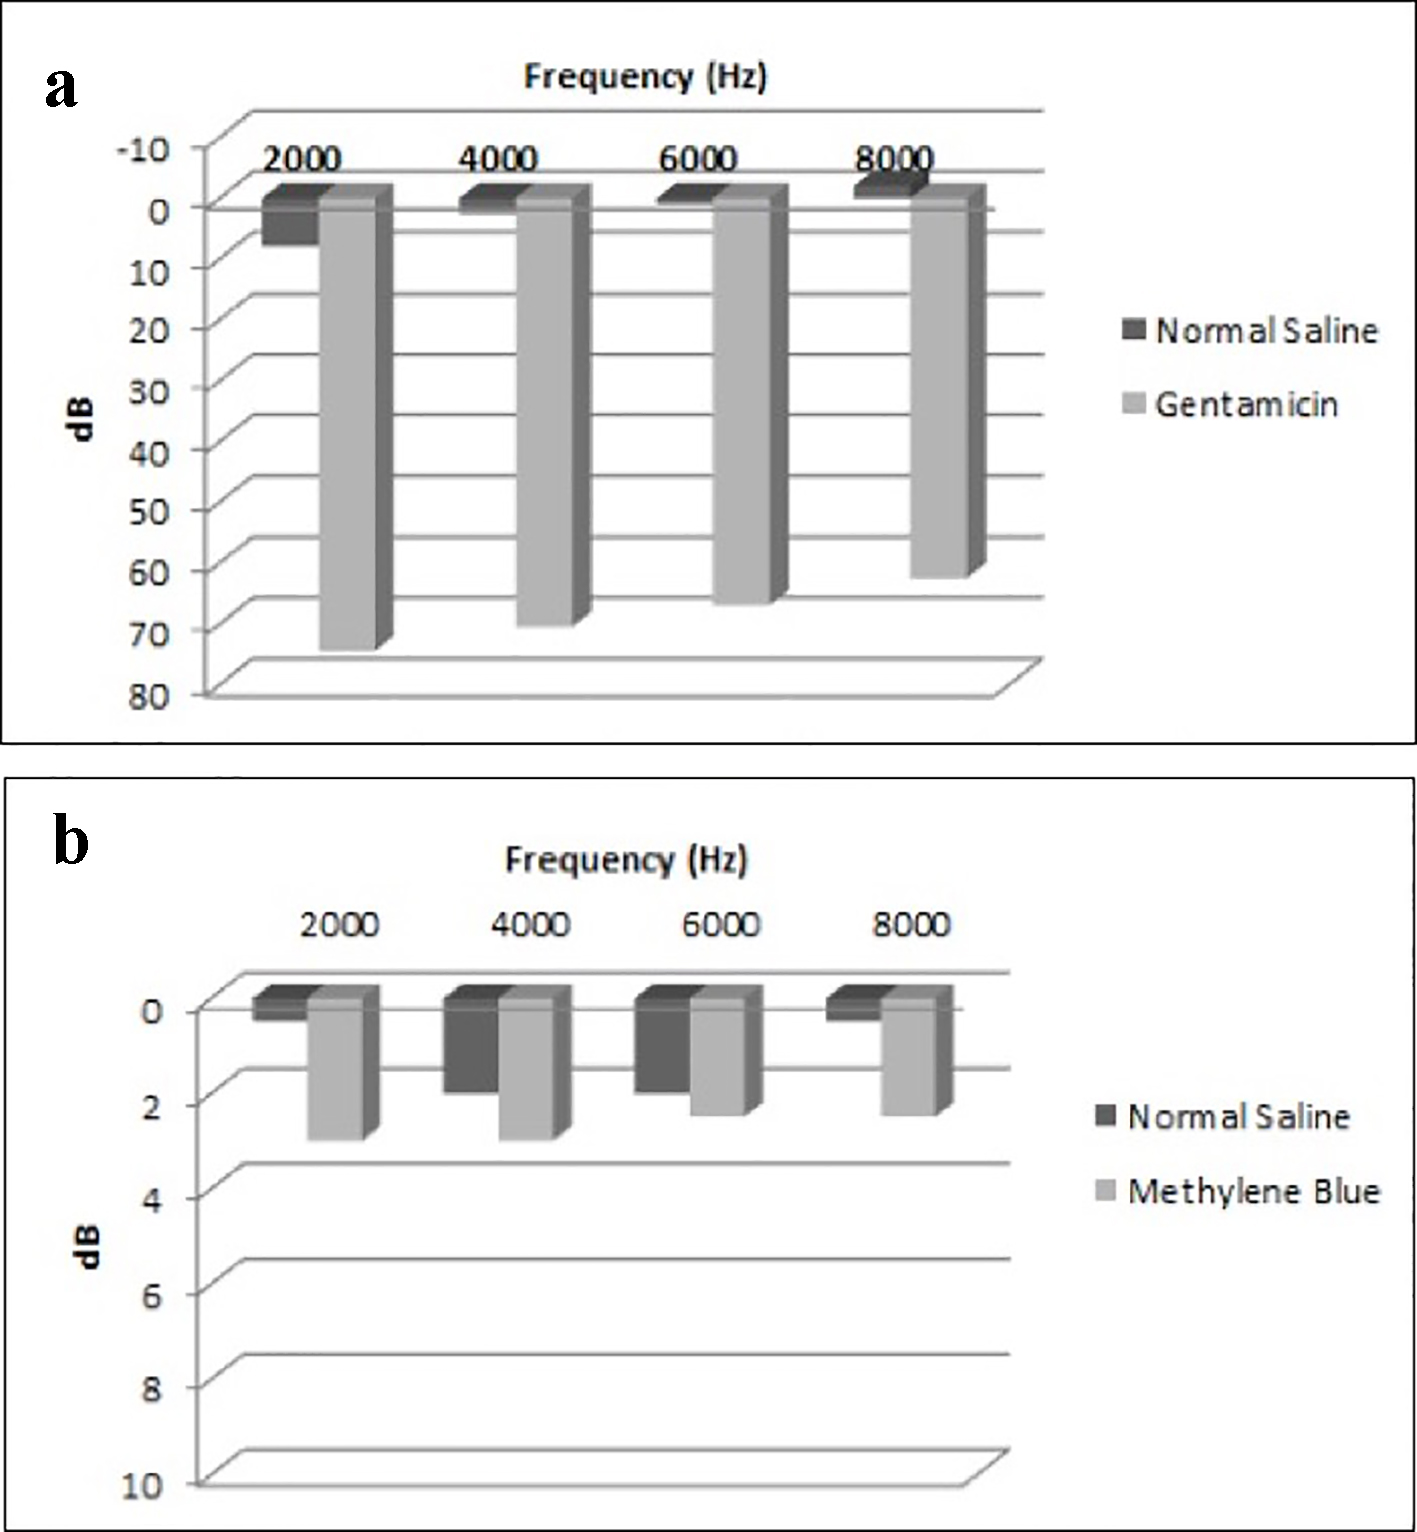
| Frequencies | Normal saline | Gentamicin | ||||
|---|---|---|---|---|---|---|
| Before | After | Hearing loss | Before | After | Hearing loss | |
| Thresholds are shown in decibels ± standard deviation. | ||||||
| 2,000 Hz | 29.00 ± 6.58 | 37.00 ± 8.88 | 8.00 ± 8.23 | 30.50 ± 6.85 | 105.00 ± 28.28 | 74.50 ± 28.62 |
| 4,000 Hz | 31.00 ± 11.25 | 33.50 ± 9.73 | 2.50 ± 4.25 | 27.50 ± 9.79 | 98.00 ± 25.95 | 70.50 ± 28.43 |
| 6,000 Hz | 24.50 ± 11.17 | 25.50 ± 7.98 | 1.00 ± 5.68 | 19.00 ± 10.49 | 86.00 ± 23.19 | 67.00 ± 26.06 |
| 8,000 Hz | 9.50 ± 10.39 | 7.50 ± 8.90 | -2.00 ± 5.37 | 4.00 ± 5.68 | 66.50 ± 25.83 | 62.50 ± 23.07 |
| Mean dB | 23.50 ± 8.68 | 25.88 ± 7.34 | 2.38 ± 4.62 | 20.25 ± 6.53 | 88.88 ± 25.19 | 68.63 ± 26.20 |
| Frequencies | Normal saline | Methylene blue | ||||
|---|---|---|---|---|---|---|
| Before | After | Hearing loss | Before | After | Hearing loss | |
| Thresholds are shown in decibels ± standard deviation. | ||||||
| 2,000 Hz | 32.50 ± 8.58 | 33.00 ± 11.60 | 0.50 ± 6.85 | 38.00 ± 6.32 | 41.00 ± 13.08 | 3.00 ± 14.18 |
| 4,000 Hz | 24.00 ± 7.75 | 26.00 ± 13.29 | 2.00 ± 12.52 | 27.50 ± 6.35 | 30.50 ± 11.41 | 3.00 ± 11.83 |
| 6,000 Hz | 14.50 ± 4.97 | 16.50 ± 13.34 | 2.00 ± 12.74 | 17.50 ± 4.86 | 20.00 ± 11.79 | 2.50 ± 12.08 |
| 8,000 Hz | -0.50 ± 5.50 | 0.00 ± 10.54 | 0.50 ± 10.66 | 2.50 ± 6.35 | 5.00 ± 11.55 | 2.50 ± 11.37 |
| Mean | 17.63 ± 6.25 | 18.88 ± 11.85 | 1.25 ± 10.47 | 21.38 ± 5.25 | 24.13 ± 11.40 | 2.75 ± 11.71 |