Journal of Clinical Medicine Research, ISSN 1918-3003 print, 1918-3011 online, Open Access
Article copyright, the authors; Journal compilation copyright, J Clin Med Res and Elmer Press Inc
Journal website http://www.jocmr.org

Original Article

Volume 9, Number 10, October 2017, pages 831-837


Intravenous Carnitine Administration in Addition to Parenteral Nutrition With Lipid Emulsion May Decrease the Inflammatory Reaction in Postoperative Surgical Patients

Figure

Figure 1.
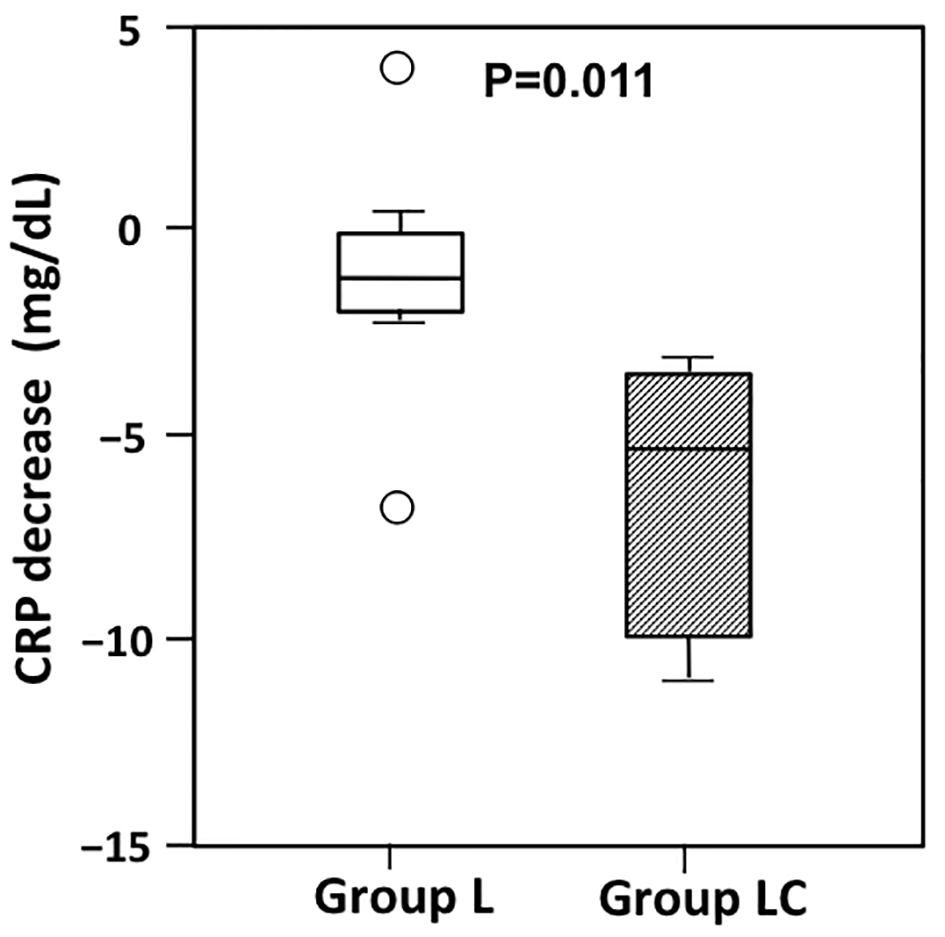
Figure 1. Changes in C-reactive protein (CRP) from postoperative day (POD) 3 to POD7 in patients receiving peripheral parenteral nutrition (PPN) alone (group L) or intravenous carnitine in addition to PPN (group LC). The decrease in CRP from POD3 to POD7 was significantly greater in group LC than in Group L (P = 0.011). The boxes show the interquartile range, with the median value indicated by the horizontal line; whiskers show the range. Circles show outliers.

Tables

Table 1. Patient Characteristics Before and After Surgery
 
Group L (n = 8)Group LC (n = 8)P-value
Data are given as the mean ± SD or as n (%). Group L: peripheral parenteral nutrition (PPN); Group LC: intravenous carnitine in addition to PPN; BMI: body mass index.
Age (years)69.3 ± 10.066.8 ± 9.20.611
Gender0.315
  Male3 (37.5)6 (75.0)
  Female5 (62.5)2 (25.0)
BMI (kg/m2)
  Preoperative21.4 ± 3.024.8 ± 2.90.038
  POD720.8 ± 3.424.3 ± 2.50.073
Tumor location0.767
  Gastric1 (12.5)1 (12.5)
  Colorectal7 (87.5)7 (87.5)
Tumor stage0.282
  I4 (50.0)7 (87.5)
  II1 (12.5)0 (0)
  III3 (37.5)1 (12.5)
Surgical procedure0.696
  Open3 (37.5)3 (37.5)
  Laparoscopic5 (62.5)5 (62.5)
Intravenous administration
  Total energy (kcal/kg/day)19.0 ± 3.216.2 ± 3.00.092
  Amino acids (g/kg/day)1.1 ± 0.20.9 ± 0.20.106


Table 2. Preoperative Laboratory Characteristics
 
Group L (n = 8)Group LC (n = 8)P-value
Data are given as the mean ± SD or as the median (interquartile range). Group L: peripheral parenteral nutrition (PPN); Group LC: intravenous carnitine in addition to PPN; WBC: white blood cell count; TLC: total lymphocyte count; RBC: red blood cell count; Hb: hemoglobin; Hct: hematocrit; Plt: platelet count; Alb: serum albumin; TTR: transthyretin; RBP: retinol-binding protein; AST: aspartate aminotransferase; ALT: alanine aminotransferase; ChE: cholinesterase; ALP: alkaline phosphatase; T-bil: total bilirubin; BUN: blood urea nitrogen; Cre: creatinine; TG: triglycerides; TC: total cholesterol; HOMA-IR: homeostasis model assessment of insulin resistance.
WBC (/µL)5,153 ± 1,6616,263 ± 1,9080.235
TLC (/µL)1,560 (1,428 - 1,783)1,838 (1,620 - 2,311)0.014
RBC (× 104/µL)402 ± 63446 ± 350.108
Hb (g/dL)12.0 ± 2.713.8 ± 1.10.096
Hct (%)36.1 ± 6.540.9 ± 3.10.780
Plt (× 104/µL)22.6 ± 4.127.2 ± 9.00.215
Alb (g/dL)4.1 ± 0.44.2 ± 0.30.459
TTR (mg/dL)30.1 ± 2.626.8 ± 8.00.325
RBP (mg/dL)5.1 ± 0.84.9 ± 1.50.702
AST (U/L)21.8 ± 5.021.1 ± 4.80.763
ALT (U/L)17.3 ± 4.419.4 ± 5.20.417
ChE (U/L)264.6 ± 57.0333.4 ± 62.40.037
ALP (U/L)232.4 ± 38.7254.8 ± 84.50.507
T-bil (mg/dL)0.8 (0.7 - 0.9)0.6 (0.4 - 0.8)0.130
BUN (mg/dL)14.5 ± 3.816.1 ± 3.40.369
Cre (mg/dL)0.6 ± 0.20.8 ± 0.20.179
TG (mg/dL)126.2 ± 71.1104.1 ± 35.40.483
TC (mg/dL)190.2 ± 22.8186.1 ± 18.70.733
HOMA-IR0.9 (0.8 - 2.4)1.8 (1.1 - 2.1)0.613
Total carnitine (µmol/L)56.0 ± 13.060.0 ± 7.60.470
Free carnitine (µmol/L)44.8 ± 11.150.2 ± 8.00.291
Acyl carnitine (µmol/L)11.3 ± 3.79.8 ± 3.00.410


Table 3. Postoperative Changes in Laboratory Parameters on PODs 1, 3, and 7 in Patients Receiving Peripheral Parenteral Nutrition (PPN) Alone (Group L) or Intravenous Carnitine in Addition to PPN (Group LC)
 
POD1POD3POD7P-value
Group LGroup LCGroup LGroup LCGroup LGroup LC
Data are given as the mean ± SD or as the median (interquartile range). *P < 0.05, **P < 0.01 compared with group L (repeated-measures ANOVA with Bonferroni post hoc correction or Friedman test); P < 0.05, ††P < 0.01 compared with POD1; P < 0.05, ‡‡P < 0.01 compared with POD3. WBC: white blood cell count; TLC: total lymphocyte count; RBC: red blood cell count; Hb: hemoglobin; Hct: hematocrit; Plt: platelet count; Alb: serum albumin; TTR: transthyretin; RBP: retinol-binding protein; AST: aspartate aminotransferase; ALT: alanine aminotransferase; ChE: cholinesterase; ALP: alkaline phosphatase; T-bil: total bilirubin; BUN: blood urea nitrogen; Cre: creatinine; TG: triglycerides; TC: total cholesterol; HOMA-IR: homeostasis model assessment of insulin resistance; CRP: C-reactive protein.
WBC (/µL)8,125 (6,313, 10,028)10,450 (7,645, 13,043)7,090 (5,253, 7,535)7,480 (6,575, 9,248)6,505 (5,078, 9,753)6,765 (5,863, 7,390)0.651
TLC (/µL)1,112 ± 3981,376 ± 5071,141 ± 2031,148 ± 4111,166 ± 4471,241 ± 4010.529
RBC (× 104/µL)367 (334, 450)397 (371, 409)365 (329, 449)425 (388, 442)383 (333, 449)422 (374, 436)0.506
Hb (g/dL)11.3 ± 2.711.9 ± 1.511.3 ± 2.712.6 ± 1.611.5 ± 2.312.5 ± 1.80.365
Hct (%)34.1 ± 6.535.6 ± 4.533.6 ± 6.937.4 ± 4.834.2 ± 5.836.6 ± 4.90.358
Plt (× 104/µL)20.0 (15.3, 24.6)18.9 (14.0, 28.0)20.7 (17.4, 25.0)22.7 (16.5, 25.3)29.9 (22.1, 28.8)29.6 (24.1, 39.0)‡‡0.798
Albumin (g/dL)3.1 ± 0.43.0 ± 0.33.0 ± 0.43.0 ± 0.43.2 ± 0.63.2 ± 0.50.773
TTR (mg/dL)19.0 ± 3.318.1 ± 3.712.1 ± 7.713.1 ± 4.618.1 ± 7.922.3 ± 6.40.470
RBP (mg/dL)2.8 ± 1.02.7 ± 0.82.8 ± 0.92.6 ± 0.83.4 ± 1.44.1 ± 1.2††0.708
AST (U/L)21.0 (15.3, 47.8)27.0 (19.5, 34.8)17.5 (13.3, 22.0)19.0 (16.5, 20.8)24.5 (13.3, 27.8)30 (22.3, 50.5)0.376
ALT (U/L)15.5 (12.0, 44.5)22.5 (14.8, 23.0)15.5 (11.5, 21.5)19 (12.8, 24.3)26 (12.7, 34.8)54.5 (32.8, 109.8)0.428
ChE (U/L)212.0 ± 57.7254.1 ± 64.5202.6 ± 70.2241.3 ± 66.4204.0 ± 76.0237.3 ± 69.00.264
ALP (U/L)173.5 (156.5, 182.5)160.5 (129.8, 203.8)170 (151.0, 197.8)159 (131.0, 200.8)212.5 (187.3, 269.3)301.5 (218.3, 567.0)0.271
T-bil (mg/dL)0.9 (0.8, 1.4)0.9 (0.8, 1.2)0.8 (0.6, 1.3)0.6 (0.5, 0.7)††0.6 (0.5, 0.9)0.5 (0.4, 0.8)0.781
BUN (mg/dL)10.0 (7.3, 16.3)13.5 (9.3, 15.8)13.0 (11.0, 16,5)14.0 (11.3, 21.3)18.0 (13.5, 20.0)‡††20.5 (14.8, 23.0)††0.447
Cre (mg/dL)0.60 ± 0.190.77 ± 0.250.56 ± 0.190.69 ± 0.190.63 ± 0.200.68 ± 0.170.252
TG (mg/dL)66.7 ± 10.580.2 ± 17.283.0 ± 6.0109.7 ± 24.489.6 ± 22.1106.0 ± 24.10.061
TC (mg/dL)139.4 ± 26.9134.2 ± 15.5153.9 ± 26.6152.8 ± 17.9††164.4 ± 29.3153.8 ± 13.40.639
HOMA-R1.77 (1.05, 4.63)2.41 (1.44, 2.81)2.49 (1.33, 7.03)3.51 (1.99, 6.74)2.18 (0.68, 3.82)2.22(1.85, 5.29)0.711
Total carnitine (µmol/L)59.0 (41.9, 78.1)65.8 (58.6, 270.7)54.3 (40.1, 59.5)252.0 (95.6, 646.0)**63.7 (51.2, 76.5)86.6 (81.4, 94.9)*0.069
Free carnitine (µmol/L)50.3 (36.3, 66.3)57.9 (50.9, 263.4)44.4 (35.6, 52.9)236.2 (85.0, 630.3)**53.2 (46.2, 60.6)74.3 (70.7, 83.1)**0.074
Acyl carnitine (µmol/L)6.8 (4.8, 9.3)7.5 (7.3, 8.0)7.4 (6.4, 9.3)13.55 (7.7, 17.1)*10.9 (5.0, 13.7)12.0 (11.1, 13.0)0.115
CRP (mg/dL)3.74 (1.82 - 8.89)7.78 (4.37 - 17.80)2.45 (0.32, 8.38)3.36 (0.75, 13.55)0.440
Nitrogen balance (g/day)-0.4 (-1.6, 2.7)2.8 (-5.9, 8.7)-4.3 (-11.3, -0.9)-4.8 (-17.0, -4.2)0.714


Table 4. Postoperative Complications in Patients Receiving Peripheral Parenteral Nutrition (PPN) Alone (Group L) or Intravenous Carnitine in Addition to PPN (Group LC)
 
Group LGroup LCP-value
Data show the number of patients in each group, with percentages in parentheses.
Postoperative complications0.715
  Yes2 (25.0)2 (25.0))
  No6 (75.0)6 (75.0)
Infectious complications
  Yes1 (12.5)1 (12.5)0.767
  No7 (87.5)7 (87.5)
Mechanical complications0.500
  Yes1 (12.5)2 (25.0)
  No7 (87.5)6 (75.0)