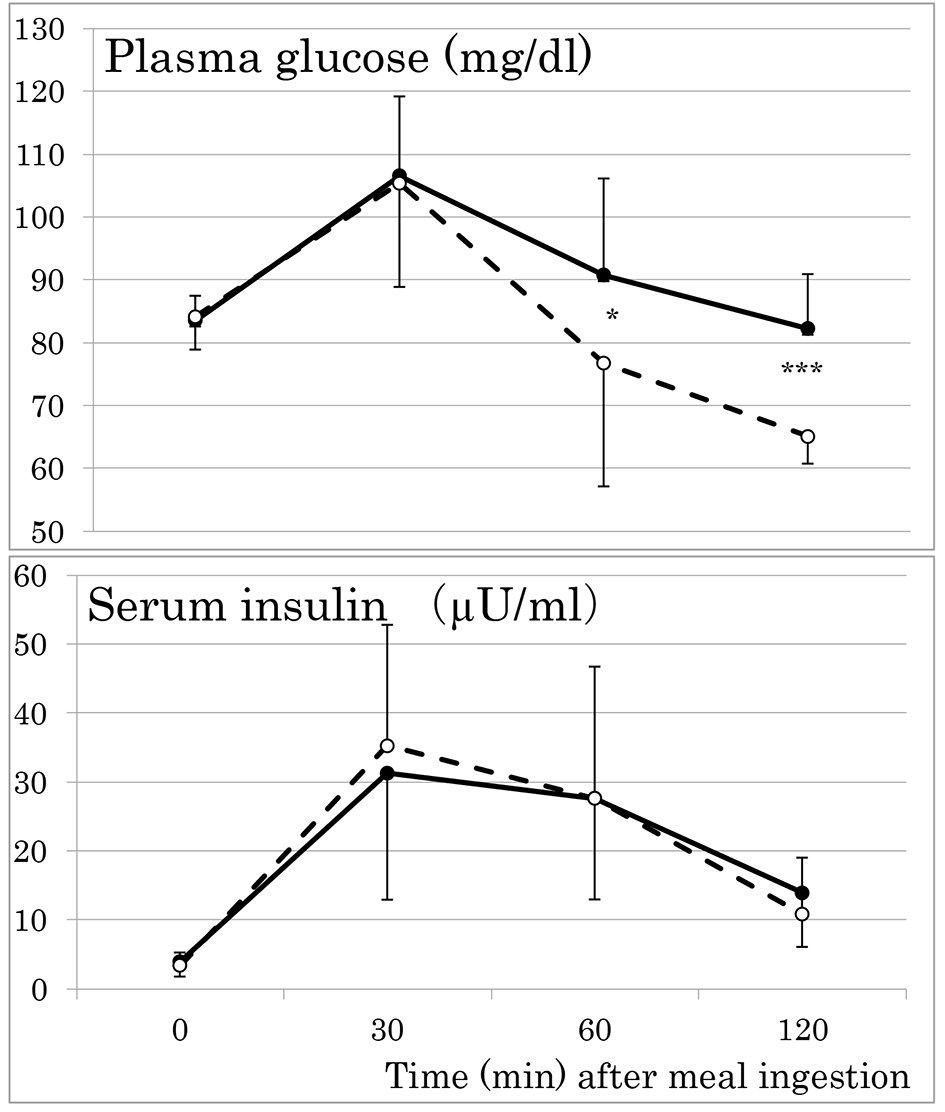
Figure 1. Responses of plasma glucose and serum insulin to a standardized test meal in young women with (broken lines) and without (solid lines) post-breakfast low glycemia (plasma glucose ≤ 70 mg/dL). Mean ± SD. *P < 0.05. ***P < 0.001.
| Journal of Clinical Medicine Research, ISSN 1918-3003 print, 1918-3011 online, Open Access |
| Article copyright, the authors; Journal compilation copyright, J Clin Med Res and Elmer Press Inc |
| Journal website http://www.jocmr.org |
Original Article
Volume 9, Number 8, August 2017, pages 680-686
Post-Prandial Plasma Glucose Less Than or Equal to 70 mg/dL Is Not Uncommon in Young Japanese Women
Figure
Tables
| Glucose at | Minimum (mg/dL) | Median (mg/dL) | Maximum (mg/dL) | Low glycemia (n, %) | Insulin, mean ± SD (µU/mL) |
|---|---|---|---|---|---|
| 0 min | 78 | 83 | 95 | 0 | 3.7 ± 2.0 |
| 30 min | 72 | 108 | 135 | 0 | 33.1 ± 17.8 |
| 60 min | 51 | 85 | 128 | 8 (22.8) | 27.6 ± 16.6 |
| 120 min | 59 | 72 | 98 | 14 (40.0) | 12.5 ± 8.0 |
| Post-breakfast low glycemia, mean ± SD | P value | ||
|---|---|---|---|
| Absent (n = 19) | Present (n = 16) | ||
| FMI: fat mass index. | |||
| BMI (kg/m2) | 21.8 ± 2.5 | 21.9 ± 2.4 | 0.930 |
| FMI (kg/m2) | 10.1 ± 3.4 | 10.0 ± 2.3 | 0.896 |
| Waist circumference (cm) | 74.1 ± 6.3 | 73.4 ± 6.4 | 0.739 |
| Arms fat mass (kg) | 1.2 ± 0.6 | 1.3 ± 0.7 | 0.550 |
| Legs fat mass (kg) | 5.9 ± 1.7 | 6.3 ± 2.5 | 0.592 |
| Trunk fat mass (kg) | 7.5 ± 3.1 | 7.1 ± 2.3 | 0.692 |
| Total fat mass (kg) | 15.1 ± 5.4 | 15.3 ± 5.2 | 0.937 |
| Arm FMI (kg/m2) | 0.45 ± 0.24 | 0.49 ± 0.25 | 0.630 |
| Legs FMI (kg/m2) | 2.25 ± 0.70 | 2.36 ± 0.88 | 0.666 |
| Trunk FMI (kg/m2) | 2.88 ± 1.24 | 2.70 ± 0.81 | 0.628 |
| Arms lean mass (kg) | 3.7 ± 0.6 | 3.9 ± 0.7 | 0.307 |
| Legs lean mass (kg) | 13.5 ± 2.4 | 13.6 ± 2.1 | 0.888 |
| Trunk lean mass (kg) | 18.7 ± 2.6 | 18.5 ± 2.6 | 0.805 |
| Total lean mass (kg) | 39.1 ± 5.7 | 39.2 ± 5.4 | 0.949 |
| Arms percentage fat (%) | 22.3 ± 9.5 | 22.8 ± 8.0 | 0.877 |
| Legs percentage fat (%) | 28.9 ± 7.1 | 29.4 ± 6.4 | 0.830 |
| Trunk percentage fat (%) | 27.2 ± 8.6 | 26.6 ± 6.0 | 0.818 |
| Total percentage fat (%) | 26.3 ± 7.5 | 26.3 ± 5.7 | 0.993 |
| Trunk/leg fat mass | 1.25 ± 0.25 | 1.18 ± 0.26 | 0.435 |
| Post-breakfast low glycemia, mean ± SD | P value | ||
|---|---|---|---|
| Absent (n = 19) | Present (n = 16) | ||
| HOMA: homeostasis model assessment; IR: insulin resistance; MIR: meal-induced insulin response; PAI-1: plasminogen activator inhibitor-1; TNF-α: tumor necrosis factor-α; hsCRP: high-sensitivity C-reactive protein; IL-6: interleukine-6; AST: aspartate aminotransferase; ALT: alanine aminotransferase; GGT: γ-glutamyltransferase; C: cholesterol; TG: triglyceride; RLP: remnant-like lipoprotein; FFA: free fatty acid; BP: blood pressure. | |||
| HbA1c (%) | 5.2 ± 0.2 | 5.1 ± 0.2 | 0.742 |
| HOMA-IR | 0.82 ± 0.47 | 0.70 ± 0.37 | 0.428 |
| MIR (µU/mg) | 225 ± 353 | 265 ± 318 | 0.738 |
| Adipose IR | 1.89 ± 0.82 | 1.48 ± 1.13 | 0.228 |
| PAI-1 (ng/mL) | 24.0 ± 9.3 | 36.0 ± 27.1 | 0.079 |
| TNF-α (pg/mL) | 0.6 ± 0.1 | 0.7 ± 0.3 | 0.228 |
| Leptin (ng/mL) | 7.3 ± 5.2 | 6.6 ± 3.1 | 0.631 |
| Adiponectin (µg/mL) | 10.4 ± 3.2 | 12.1 ± 5.6 | 0.268 |
| Leptin/adiponectin ratio | 0.77 ± 0.59 | 0.66 ± 0.50 | 0.535 |
| IL-6 (pg/mL) | 0.68 ± 0.33 | 0.64 ± 0.29 | 0.680 |
| AST (U/L) | 18.3 ± 4.0 | 16.8 ± 6.9 | 0.428 |
| ALT (U/L) | 13.3 ± 4.3 | 12.1 ± 3.9 | 0.378 |
| GGT (U/L) | 12.4 ± 2.8 | 12.5 ± 2.7 | 0.933 |
| Apolipoprotein A1 (mg/dL) | 161 ± 14 | 157 ± 15 | 0.470 |
| Apolipoprotein B (mg/dL) | 67 ± 15 | 66 ± 13 | 0.948 |
| Total-C (mg/dL) | 180 ± 23 | 177 ± 23 | 0.726 |
| HDL-C (mg/dL) | 75 ± 12 | 72 ± 11 | 0.416 |
| LDL-C (mg/dL) | 93 ± 20 | 94 ± 19 | 0.830 |
| TG (mg/dL) | 57 ± 21 | 52 ± 15 | 0.444 |
| RLP-C (mg/dL) | 2.9 ± 1.2 | 2.7 ± 0.7 | 0.505 |
| FFA (mEq/L) | 0.51 ± 0.14 | 0.42 ± 0.17 | 0.108 |
| Systolic BP (mm Hg) | 114 ± 7 | 111 ± 8 | 0.321 |
| Diastolic BP (mm Hg) | 69 ± 6 | 66 ± 6 | 0.083 |
| Post-breakfast low glycemia, mean ± SD | P value | ||
|---|---|---|---|
| Absent (n = 19) | Present (n = 16) | ||
| TG: triglyceride; RLP-C: remnant-like lipoprotein-cholesterol; FFA: free fatty acid. | |||
| TG 0 min (mg/dL) | 57 ± 21 | 52 ± 15 | 0.444 |
| TG 30 min (mg/dL) | 62 ± 23 | 60 ± 23 | 0.739 |
| TG 60 min (mg/dL) | 73 ± 28 | 72 ± 24 | 0.902 |
| TG 120 min (mg/dL) | 77 ± 29 | 82 ± 31 | 0.673 |
| RLP-C 0 min (mg/dL) | 2.9 ± 1.2 | 2.7 ± 0.7 | 0.505 |
| RLP-C 30 min (mg/dL) | 3.0 ± 1.2 | 2.8 ± 0.7 | 0.468 |
| RLP-C 60 min (mg/dL) | 3.3 ± 1.4 | 3.1 ± 0.8 | 0.451 |
| RLP-C 120 min (mg/dL) | 3.1 ± 1.3 | 3.0 ± 0.8 | 0.806 |
| FFA 0 min (mEq/L) | 0.51 ± 0.14 | 0.42 ± 0.17 | 0.108 |
| FFA 30 min (mEq/L) | 0.38 ± 0.11 | 0.32 ± 0.11 | 0.129 |
| FFA 60 min (mEq/L) | 0.24 ± 0.06 | 0.23 ± 0.08 | 0.523 |
| FFA 120 min (mEq/L) | 0.22 ± 0.04 | 0.25 ± 0.07 | 0.168 |
| B, mean ± SD | A, mean ± SD | P value | |
|---|---|---|---|
| HOMA: homeostasis model assessment; IR: insulin resistance; MIR: meal-induced insulin response. | |||
| Athletes (n, %) | 4 (57.1) | 13 (46.4) | 0.691 |
| BMI (kg/m2) | 21.3 ± 1.5 | 22.0 ± 2.6 | 0.489 |
| Waist circumference (cm) | 71.4 ± 4.2 | 74.4 ± 6.6 | 0.268 |
| Fat mass index (kg/m2) | 5.42 ± 1.32 | 5.87 ± 2.16 | 0.606 |
| Percentage body fat (%) | 25.8 ± 6.0 | 26.5 ± 6.9 | 0.827 |
| Trunk/leg fat mass | 1.24 ± 0.16 | 1.21 ± 0.27 | 0.799 |
| Glucose (mg/dL) 0 min | 82 ± 4 | 84 ± 5 | 0.273 |
| Glucose (mg/dL) 30 min | 111 ± 9 | 105 ± 15 | 0.355 |
| Glucose (mg/dL) 60 min | 95 ± 16 | 82 ± 19 | 0.100 |
| Glucose (mg/dL) 120 min | 90 ± 5 | 70 ± 8 | 0.000 |
| Insulin (µU/mL) 0 min | 3.3 ± 1.2 | 3.8 ± 2.2 | 0.594 |
| Insulin (µU/mL) 30 min | 29.4 ± 15.8 | 34.0 ± 18.4 | 0.554 |
| Insulin (µU/mL) 60 min | 22.4 ± 14.4 | 28.9 ± 17.1 | 0.361 |
| Insulin (µU/mL) 120 min | 14.6 ± 8.5 | 12.0 ± 8.0 | 0.436 |
| HbA1c (%) | 5.1 ± 0.3 | 5.2 ± 0.2 | 0.848 |
| HOMA-IR | 0.67 ± 0.23 | 0.79 ± 0.46 | 0.519 |
| MIR (µU/mg) | 89 ± 36 | 283 ± 366 | 0.014 |
| Adipose IR | 1.90 ± 0.76 | 1.66 ± 1.04 | 0.565 |
| Leptin (ng/mL) | 6.5 ± 4.1 | 7.1 ± 4.5 | 0.737 |
| Adiponectin (µg/mL) | 10.5 ± 2.7 | 11.4 ± 4.8 | 0.631 |