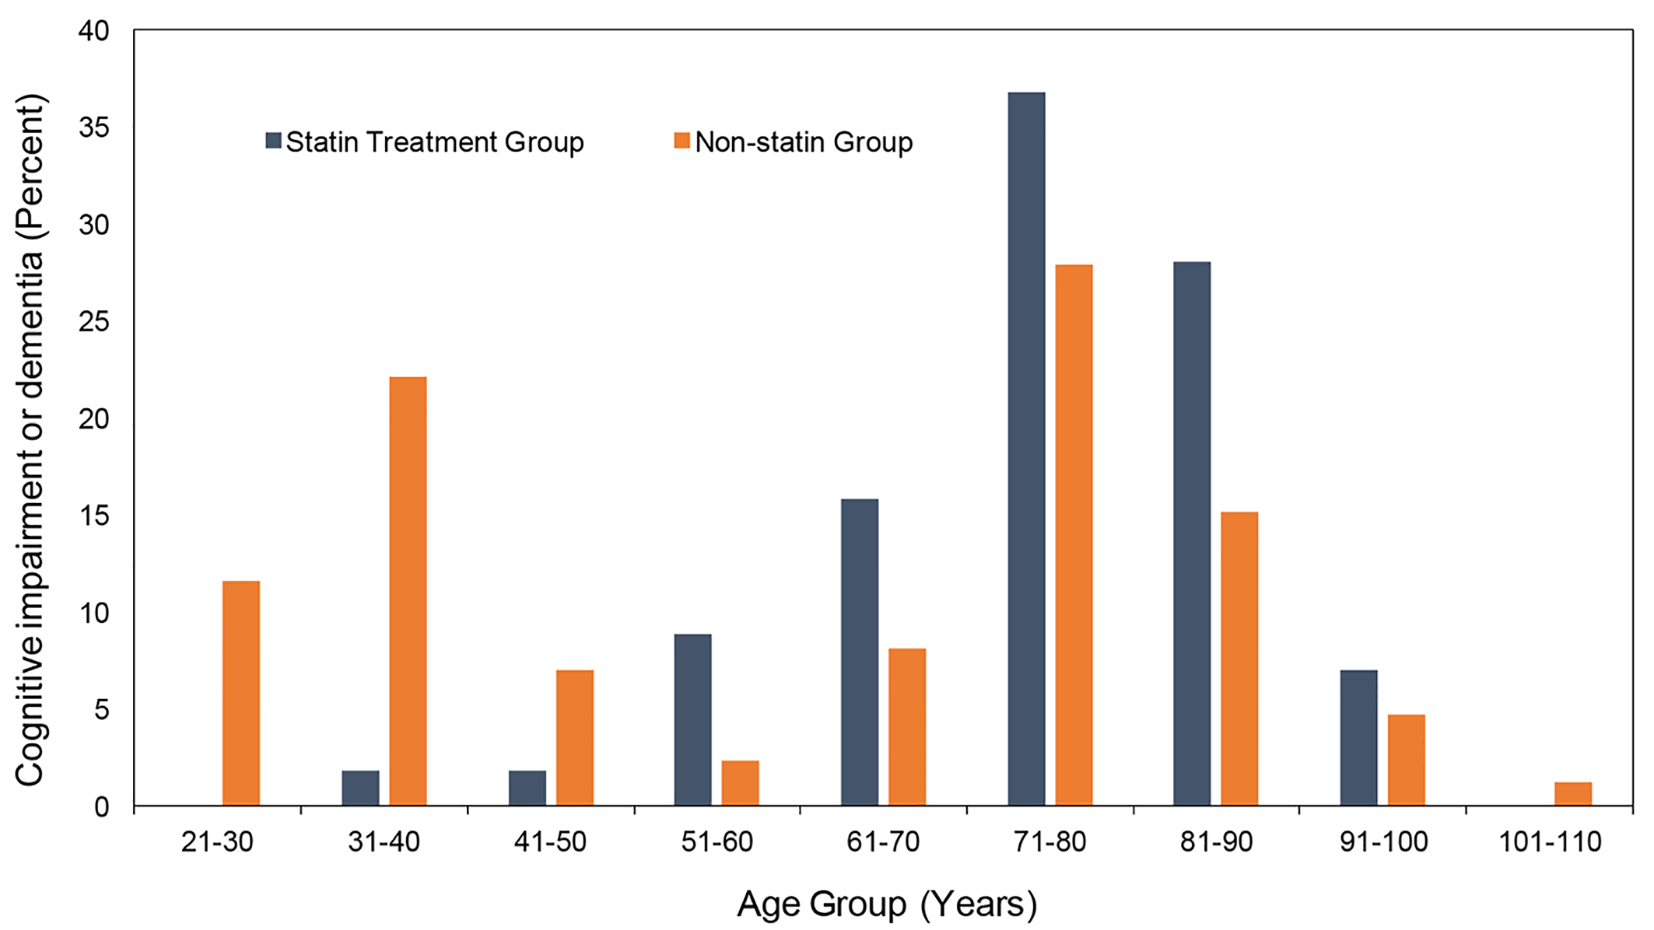
Figure 1. Comparative frequency of all cases of cognitive impairment or dementia based on age group.
| Journal of Clinical Medicine Research, ISSN 1918-3003 print, 1918-3011 online, Open Access |
| Article copyright, the authors; Journal compilation copyright, J Clin Med Res and Elmer Press Inc |
| Journal website http://www.jocmr.org |
Original Article
Volume 9, Number 7, July 2017, pages 638-649
Association of Cognitive Impairment in Patients on 3-Hydroxy-3-Methyl-Glutaryl-CoA Reductase Inhibitors
Figures
Tables
| Variable | All (n = 3,500) | Group 1: statin treatment group (n = 720) | Group 2: non-statin treatment group (n = 2,780) | P value (1 vs. 2) |
|---|---|---|---|---|
| *Wilcoxon two-sample test. †Fisher’s exact test. | ||||
| Age (years), mean (SD) | 46.9 (17.6) | 65.8 (14.3) | 46.9 (16.5) | < 0.001* |
| Gender | ||||
| Male (n, %) | 1,590 (45.4) | 405 (56.2) | 1,185 (42.6) | < 0.001† |
| Female (n, %) | 1,910 (54.6) | 315 (43.8) | 1,595 (57.4) | < 0.001† |
| Race | < 0.001† | |||
| Caucasian (n, %) | 2,179 (62.3) | 511 (71.0) | 1,668 (60.0) | |
| African American (n, %) | 473 (13.5) | 74 (10.3) | 399 (14.4) | |
| Hispanic (n, %) | 326 (9.3) | 50 (6.9) | 276 (9.9) | |
| Other (n, %) | 522 (14.9) | 85 (11.8) | 437 (15.7) | |
| Social factors | ||||
| Alcohol (n, %) | 1,654 (47.3) | 318 (44.2) | 1,336 (48.1) | 0.066† |
| Cigarettes (n, %) | 1,308 (37.4) | 363 (50.5) | 945 (34.0) | < 0.001† |
| Drugs (n, %) | 149 (4.3) | 24 (3.3) | 125 (4.5) | 0.169† |
| Variable | Group 1: statin treatment group (n = 720) | Group 2: non-statin treatment group (n = 2,780) | P* value (1 vs. 2) |
|---|---|---|---|
| *Fisher’s exact test. | |||
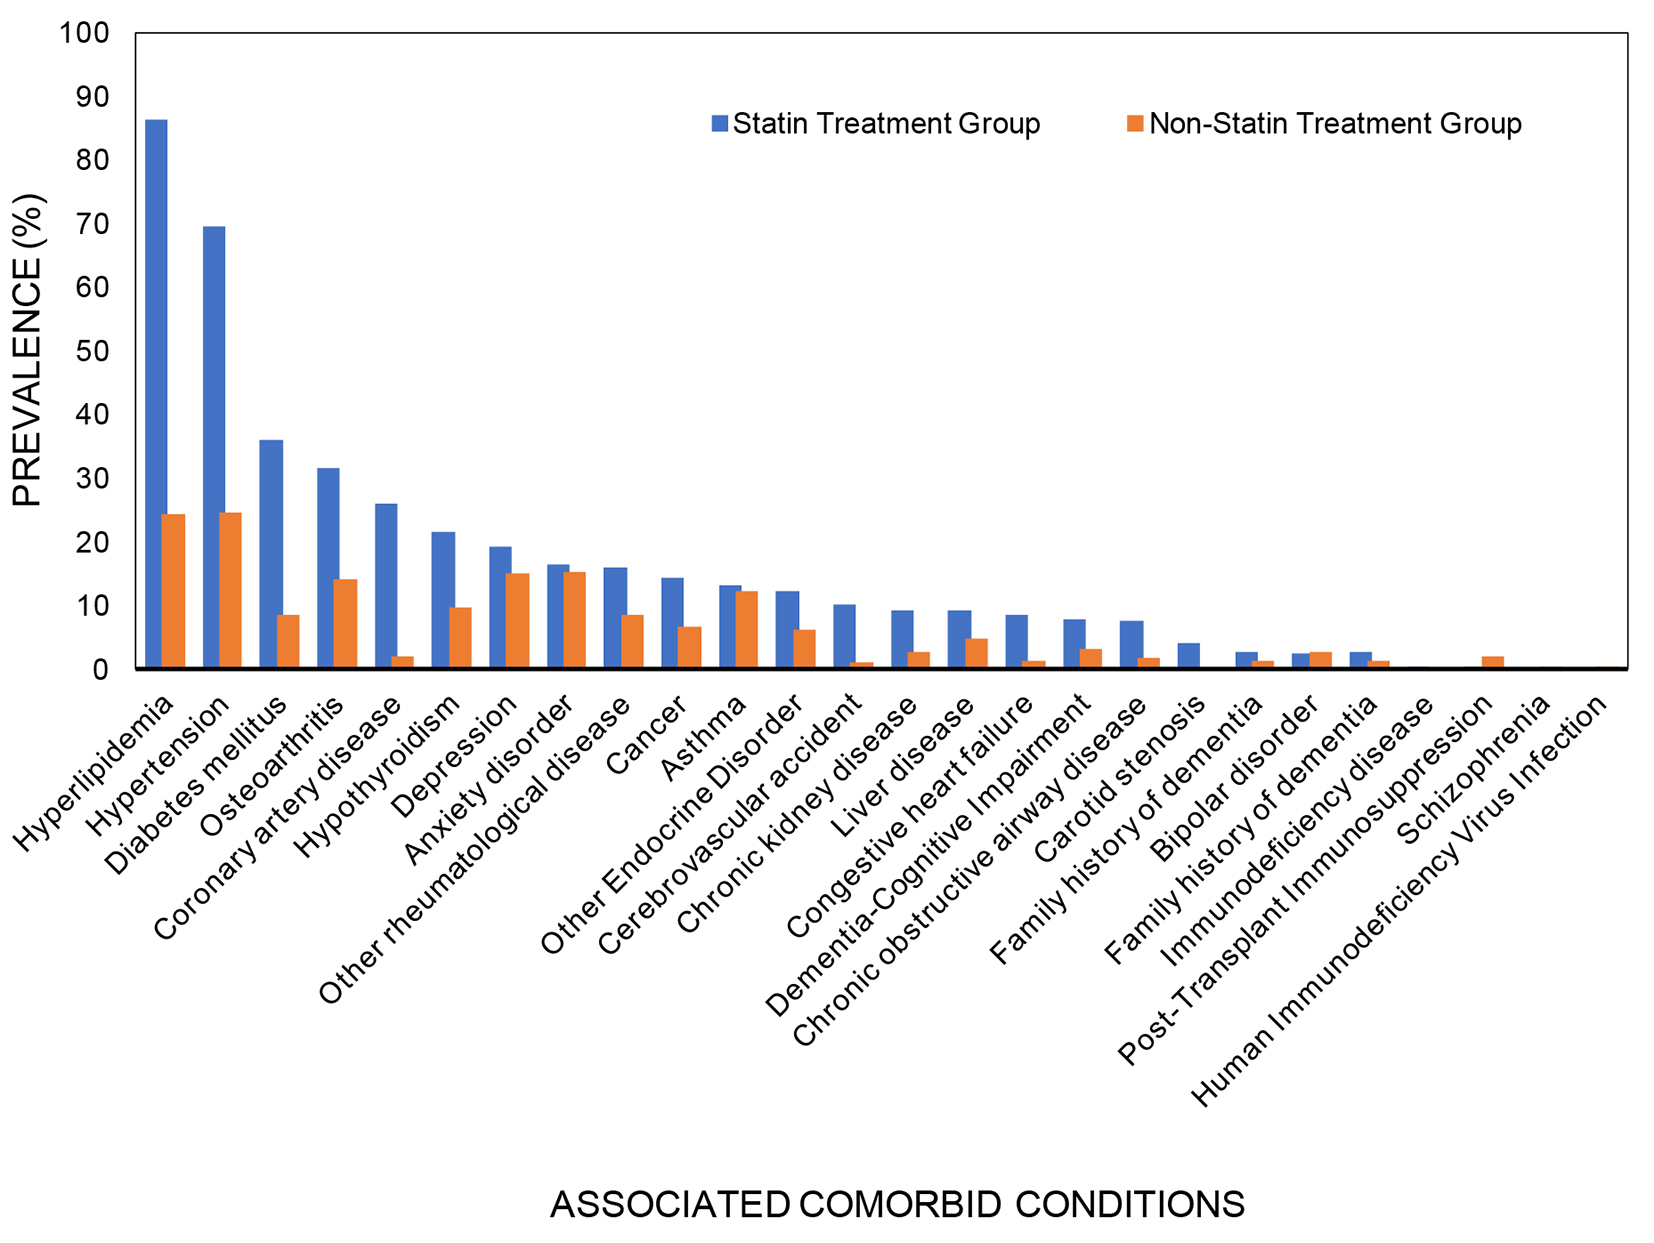
| Hyperlipidemia (n, %) | 621 (86.3) | 677 (24.4) | < 0.001 |
| Hypertension (n, %) | 501 (69.6) | 683 (24.6) | < 0.001 |
| Diabetes mellitus (n, %) | 259 (36.0) | 237 (8.5) | < 0.001 |
| Osteoarthritis (n, %) | 227 (31.5) | 396 (14.2) | < 0.001 |
| Coronary artery disease (n, %) | 188 (26.1) | 56 (2.0) | < 0.001 |
| Hypothyroidism (n, %) | 155 (21.5) | 266 (9.6) | < 0.001 |
| Depression (n, %) | 139 (19.3) | 421 (15.1) | < 0.001 |
| Anxiety disorder (n, %) | 118 (16.4) | 426 (15.3) | 0.482 |
| Other rheumatological disease (n, %) | 115 (16.0) | 240 (8.6) | < 0.001 |
| Cancer (n, %) | 104 (14.4) | 183 (6.6) | < 0.001 |
| Asthma (n, %) | 96 (13.3) | 343 (12.3) | 0.474 |
| Other endocrine disorder (n, %) | 88 (12.2) | 173 (6.2) | < 0.001 |
| Cerebrovascular accident (n, %) | 73 (10.1) | 34 (1.2) | < 0.001 |
| Chronic kidney disease (n, %) | 67 (9.3) | 75 (2.7) | < 0.001 |
| Liver disease (n, %) | 66 (9.2) | 137 (4.9) | < 0.001 |
| Congestive heart failure (n, %) | 61 (8.5) | 36 (1.3) | < 0.001 |
| Dementia-cognitive impairment (n, %) | 57 (7.9) | 86 (3.1) | < 0.001 |
| Chronic obstructive airway disease (n, %) | 55 (7.6) | 48 (1.7) | < 0.001 |
| Carotid stenosis (n, %) | 30 (4.2) | 6 (0.2) | < 0.001 |
| Family history of dementia (n, %) | 19 (2.6) | 40 (1.4) | 0.026 |
| Bipolar disorder (n, %) | 18 (2.5) | 72 (2.6) | 0.892 |
| Immunodeficiency disease (n, %) | 2 (0.3) | 3 (0.1) | 0.274 |
| Post-transplant immunosuppression (n, %) | 2 (0.3) | 57 (2.1) | 0.001 |
| Schizophrenia (n, %) | 1 (0.1) | 11 (0.4) | 0.479 |
| Human immunodeficiency virus infection (n, %) | 1 (0.1) | 7 (0.3) | 1.000 |
| Variable | Group 1: statin treatment group (n = 511) | Group 2: non-statin treatment group (n = 1,004) | P* value (1 vs. 2) |
|---|---|---|---|
| *Fisher’s exact test. NS: not significant. | |||
| Age (years), mean (SD) | 56.6 (8.3) | 61.2 (8.1) | NS |
| Hyperlipidemia (n, %) | 460 (90.0) | 431 (42.9) | < 0.001 |
| Hypertension (n, %) | 363 (71.0) | 426 (42.4) | < 0.001 |
| Diabetes mellitus (n, %) | 194 (37.9) | 141 (14.0) | < 0.001 |
| Osteoarthritis (n, %) | 163 (31.9) | 252 (25.1) | < 0.001 |
| Coronary artery disease (n, %) | 130 (25.4) | 38 (3.8) | < 0.001 |
| Hypothyroidism (n, %) | 101 (19.8) | 147 (14.6) | NS |
| Depression (n, %) | 102 (19.9) | 172 (17.2) | NS |
| Anxiety disorder (n, %) | 78 (15.3) | 158 (15.7) | NS |
| Other rheumatological disease (n, %) | 77 (15.1) | 150 (14.9) | NS |
| Cancer (n, %) | 71 (13.9) | 120 (12.0) | NS |
| Asthma (n, %) | 73 (14.3) | 127 (12.6) | NS |
| Other endocrine disorder (n, %) | 60 (11.7) | 88 (8.8) | NS |
| Cerebrovascular accident (n, %) | 42 (8.2) | 20 (2.0) | < 0.001 |
| Chronic kidney disease (n, %) | 67 (9.3) | 49 (4.9) | < 0.001 |
| Liver disease (n, %) | 49 (9.6) | 67 (6.7) | NS |
| Congestive heart failure (n, %) | 37 (7.2) | 18 (1.8) | < 0.001 |
| Dementia-cognitive impairment (n, %) | 35 (6.8) | 33 (3.3) | < 0.001 |
| Chronic obstructive airway disease (n, %) | 35 (6.8) | 34 (3.4) | < 0.001 |
| Carotid stenosis (n, %) | 19 (3.7) | 5 (0.5) | < 0.001 |
| Family history of dementia (n, %) | 15 (2.9) | 23 (2.3) | NS |
| Bipolar disorder (n, %) | 12 (2.3) | 18 (1.8) | NS |
| Immunodeficiency disease (n, %) | 2 (0.4) | 2 (0.2) | NS |
| Post-transplant immunosuppression (n, %) | 2 (0.4) | 57 (5.7) | < 0.001 |
| Schizophrenia (n, %) | 0 (0.0) | 6 (0.6) | NS |
| Human immunodeficiency virus infection (n, %) | 0 (0.0) | 2 (0.2) | NS |
| Variable | Group 1: statin treatment group (n = 720) | Group 2: non-statin treatment group (n = 2,780) | P* value (1 vs. 2) |
|---|---|---|---|
| BMI: body mass index; SBP: systolic blood pressure; DBP: diastolic blood pressure; TC: total cholesterol; TG: triglyceride; HDL-C: high-density lipoprotein cholesterol; LDL-C: low-density lipoprotein cholesterol. *Wilcoxon two-sample test. | |||
| Vitals | |||
| BMI (kg/m2), mean (SD) | 29.7 (6.5) | 29.5 (10.9) | 0.556 |
| SBP (mm Hg), mean (SD) | 127.4 (14.9) | 123 (13.7) | < 0.001 |
| DBP (mm Hg, mean (SD) | 75.9 (9.6) | 76.5 (9.1) | 0.141 |
| Lab tests | |||
| TC (mg/dL), mean (SD) | 176.5 (47.4) | 185.1 (35.9) | < 0.001 |
| TG (mg/dL), mean (SD) | 136.1 (102.3) | 113.4 (70.8) | < 0.001 |
| HDL-C (mg/dL), mean (SD) | 51.2 (15.8) | 54.5 (17.9) | < 0.001 |
| LDL-C (mg/dL), mean (SD) | 98.0 (40.8) | 108.2 (30.8) | < 0.001 |
| Variable | Dementia or cognitive impairment (n = 143) | No dementia or cognitive impairment (n = 3,357) | P |
|---|---|---|---|
| Statin therapy (n, %) | 57 (39.9) | 662 (18.9) | < 0.001 |