Journal of Clinical Medicine Research, ISSN 1918-3003 print, 1918-3011 online, Open Access
Article copyright, the authors; Journal compilation copyright, J Clin Med Res and Elmer Press Inc
Journal website http://www.jocmr.org

Original Article

Volume 9, Number 8, August 2017, pages 671-679


Oligoclonal Pattern/Abnormal Protein Bands in Post-Treatment Plasma Cell Myeloma Patients: Implications for Protein Electrophoresis and Serum Free Light Chain Assay Results

Figures

Figure 1.
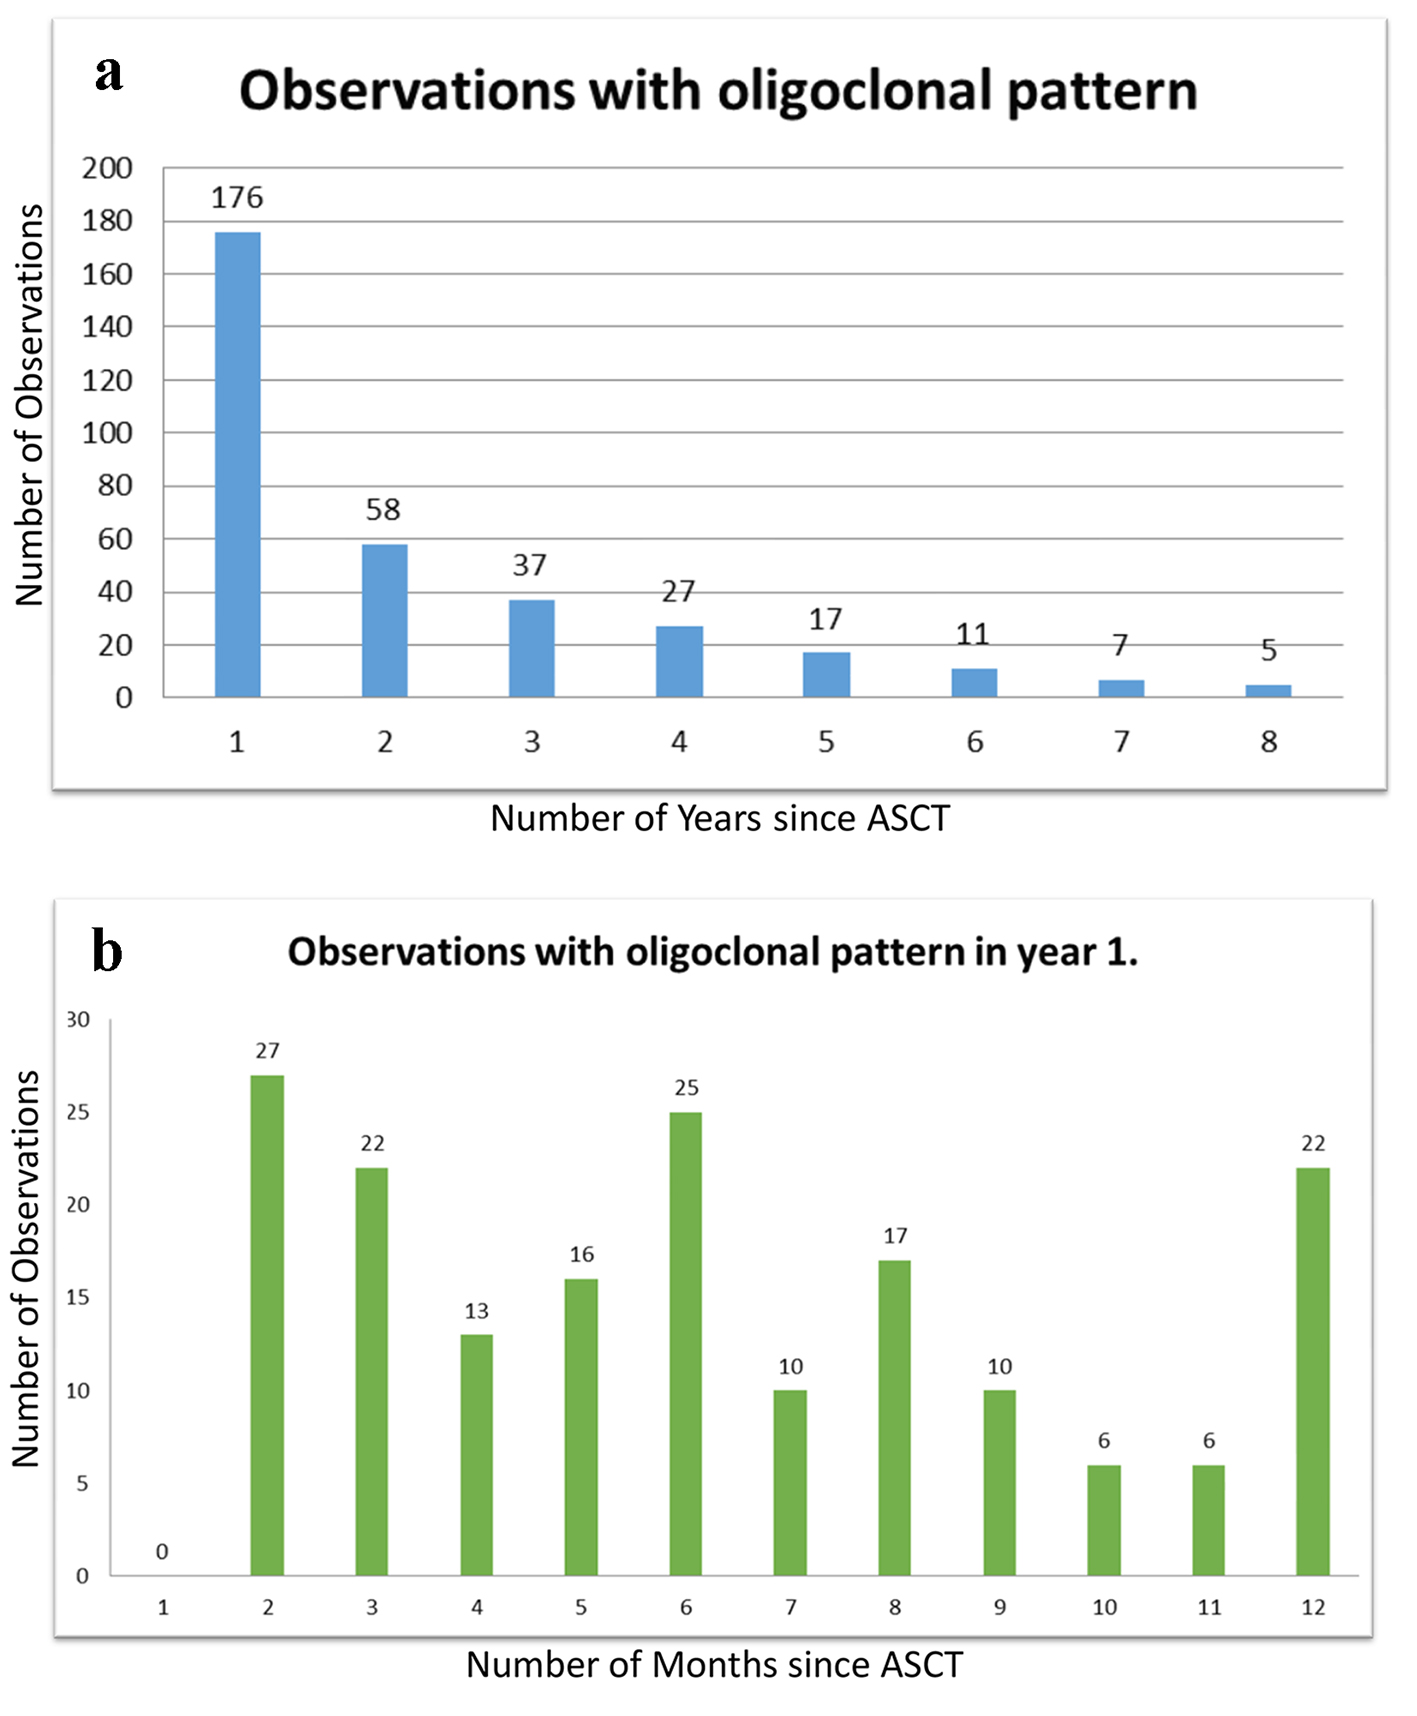
Figure 1. (a, b) Chronology of oligoclonal bands. More than half of the 321 instances of oligoclonal bands were noted in the first year after ASCT, though the bands continued to occur up to 8 years after transplantation as shown in chart (a). Chart (b) shows the frequency of oligoclonal bands in the first year, at monthly intervals. No oligoclonal bands were noted in the first month, likely mostly due to paucity of observations during that period.
Figure 2.
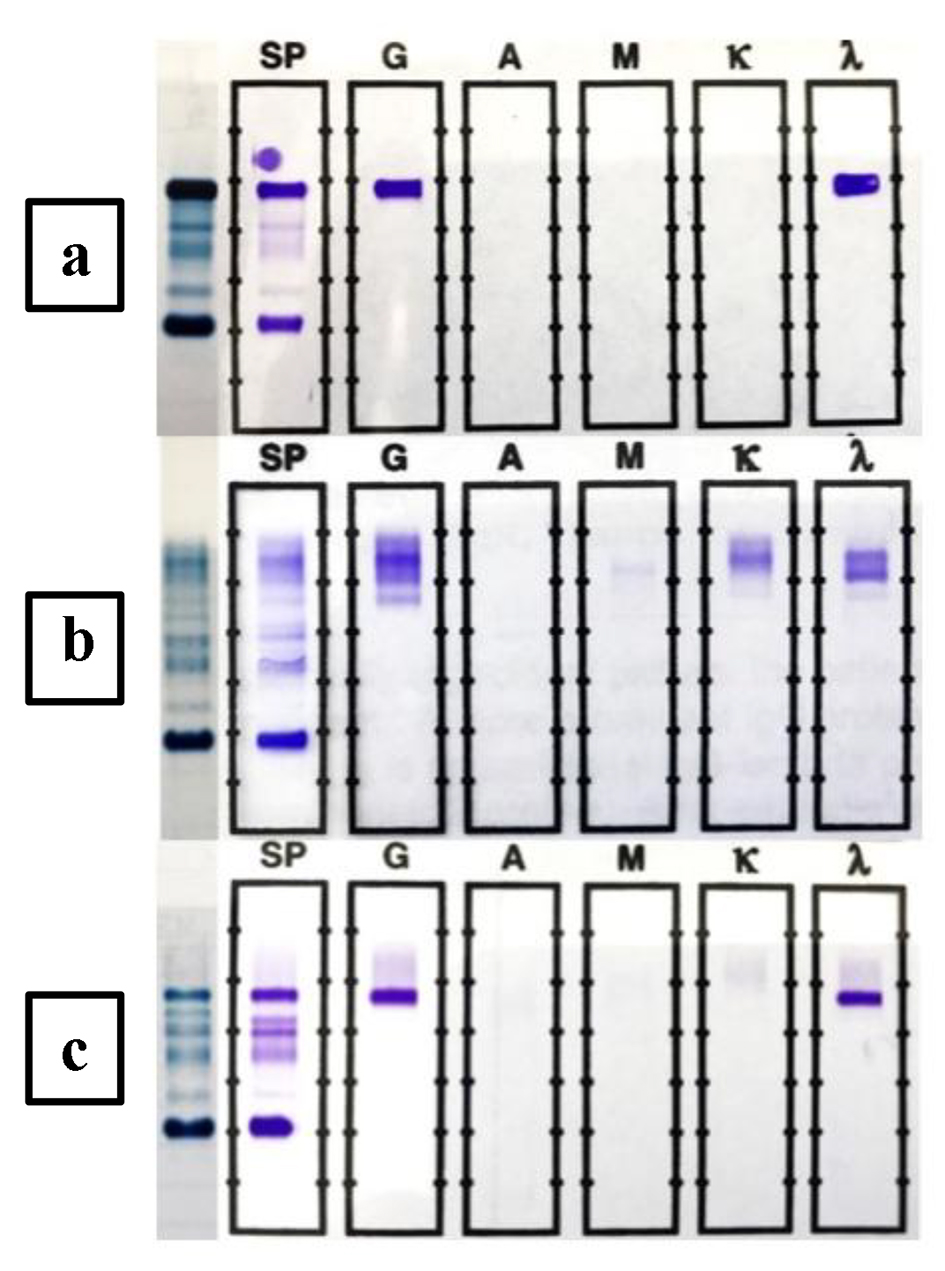
Figure 2. Time course of oligoclonal patterns in a selected patient. The SPEP patterns are shown in the left lane in all of the three SPEP/SIFE records shown. The top SPEP/SIFE (a) was done in February 2010 and displayed a monoclonal IgG lambda band in the anodal gamma region. When the protein was present in high concentration (4.13 g/dL), as was the case at this time, the band overlapped the C3 band. The κ/λ ratio was appropriately lambda dominant at 0.0001. The middle SPEP/SIFE (b) was done in November 2010, 2 months after ASCT. The original malignant IgG lambda band is detectable in the anodal gamma region. One prominent IgG kappa, an additional fainter IgG kappa band, cathodal to the more prominent one, and two lambda light chain bands are readily detectable, cathodal to the malignant band. Despite the presence of original monoclonal IgG lambda and two oligoclonal lambda bands, the κ/λ ratio was kappa dominant at 18.9. The κ/λ ratio remained normal/neutral for the next 28 months, despite the recurrence of the malignant IgG lambda. The κ/λ ratio became lambda dominant when the concentration of the recurrent malignant IgG lambda monoclonal protein reached 1.67 g/dL. The lower SPEP/SIFE (c) was done in September 2016 and by then all of the oligoclonal bands had disappeared and the malignant IgG lambda band was present at a concentration of 2.62 g/dL. While it entails the benefit of retrospective review, the two lambda light chain bands depicted in the middle figure did not represent light chain escape in a treated patient but were part of an oligoclonal response.

Tables

Table 1. Oligoclonal Frequency
 
No ASCTPre-ASCTASCTPost-ASCT
In 227 patients the relevant data regarding SPEP/SIFE and SFLCA were available. Autologous hematopoietic stem cell transplantation was carried out in 159 patients. At least three observations were available in all patients and in the ASCT patients, at least two observations were available following stem cell transplantation. The frequencies of oligoclonal pattern in patients without ASCT, prior to ASCT, and following ASCT are given. The incidence of oligoclonal pattern was markedly and significantly higher after ASCT. *Three patients had oligoclonal l pattern before ASCT but not after transplantation. The frequency of oligoclonal pattern was significantly higher following ASCT than that observed without ASCT (P = 0.000003).
Patients68NA159NA
Observations - N8163942,1291,735
Patients with oligo6 (8.8%)59592* (57.9%)
Observations with oligo1813348335


Table 2. ASCT Samples and Oligoclonal Frequency
 
Obs.Obs. with oligo
Samples from patients in post-ASCT state had significantly higher frequency of oligoclonal pattern as compared to pre-transplant state and patients who did not receive ASCT. Obs.: observations in samples; Oligo: oligoclonal pattern.
Obs. without and before ASCT1,21031 (2.56%)Chi-square: 147.8
Obs. after ASCT1,735335 (19.31%)P << 0.00001
Obs. in pts without ASCT81618 (2.21%)Chi-square: 98.73
Obs. in pts with ASCT2,129348 (16.35%)P << 0.00001


Table 3. Light Chain Type in Oligoclonal Patterns
 
Oligo qualityKappaLambdaBothTotal
For the samples presented in Table 2, the oligoclonal bands with kappa and lambda light chains were about equally distributed. However, judging by the intensity of staining in SIFE, kappa bands tended to be in higher concentration.
4453154251


Table 4. SFLCA and Light Chain Type of Primary Myeloma Protein Samples
 
Primary LCSFLCA results
ConcordantNon-concordantDiscordant
For 251 samples with oligoclonal pattern, both the light chain type of the myeloma protein and SFLCA results were available. The results of the concordance of the SFLCA result with that of the malignant light chain revealed 13 (15.5%) cases of lambda light chain type (not just lambda light chain in isolation but any immunoglobulin with lambda light chain) exhibited kappa chain dominant κ/λ ratio. It could be surmised that of the 69 samples from patients with kappa chain myeloma protein, about 15.5% would not have exhibited kappa chain dominance of κ/λ ratio without oligoclonal pattern. Thus, the presence of oligoclonal pattern further mars the marginal usefulness of SFLCA.
Kappa - 16769980Chi-square: 41.25
Lambda - 84116013 (15.5%)P < 0.00001