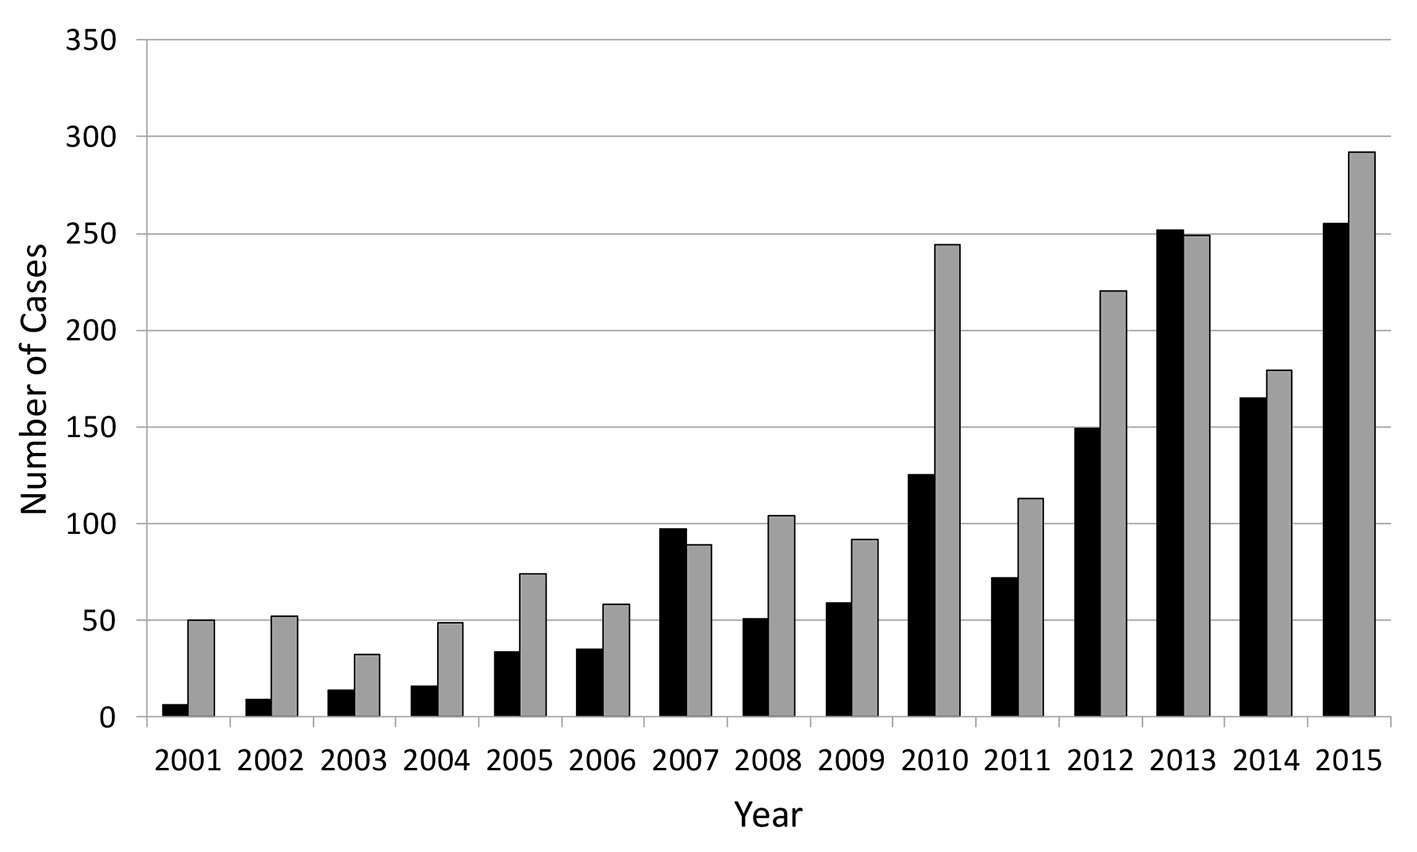
Figure 1. Annual change of dengue cases imported into Korea and Japan, 2011 - 2015. Bars represent the number of reported cases each year in Korea (black) and Japan (gray).
| Journal of Clinical Medicine Research, ISSN 1918-3003 print, 1918-3011 online, Open Access |
| Article copyright, the authors; Journal compilation copyright, J Clin Med Res and Elmer Press Inc |
| Journal website http://www.jocmr.org |
Short Communication
Volume 9, Number 7, July 2017, pages 650-653
A Comparative Study of the Trends of Imported Dengue Cases in Korea and Japan 2011 - 2015
Figures
Table
| No. of cases (%) | ||
|---|---|---|
| Korea | Japan | |
| No. of total cases | 893 | 1,054 |
| Cumulative incidence per 100,000 oversea travelers | 1.16 | 1.22 |
| Suspected source country/areas | ||
| Southeast Asia | 798 (89.4) | 795 (75.4) |
| The Philippines | 340 (38.1) | 232 (22.0) |
| Indonesia | 103 (11.5) | 246 (23.3) |
| Thailand | 123 (13.8) | 134 (12.7) |
| Vietnam | 45 (5.0) | 21 (2.0) |
| Cambodia | 66 (7.4) | 38 (3.6) |
| Laos | 17 (1.9) | 8 (0.8) |
| Malaysia | 52 (5.8) | 71 (6.7) |
| Myanmar | 33 (3.7) | 29 (2.8) |
| Singapore | 18 (2.0) | 13 (1.2) |
| East Timor | 1 (0.1) | 3 (0.3) |
| Southern Asia | 60 (7.5) | 130 (12.3) |
| India | 39 (4.4) | 81 (7.7) |
| Bangladesh | 18 (2.0) | 14 (1.3) |
| Maldives | 3 (0.3) | 9 (0.9) |
| Sri Lanka | 7 (0.8) | 26 (2.5) |
| Eastern Asia | 5 (0.6) | 5 (0.5) |
| China | 3 (0.3) | 1 (0.1) |
| Taiwan | 2 (0.2) | 4 (0.4) |
| Others or unknown | 23 (2.6) | 124 (11.8) |