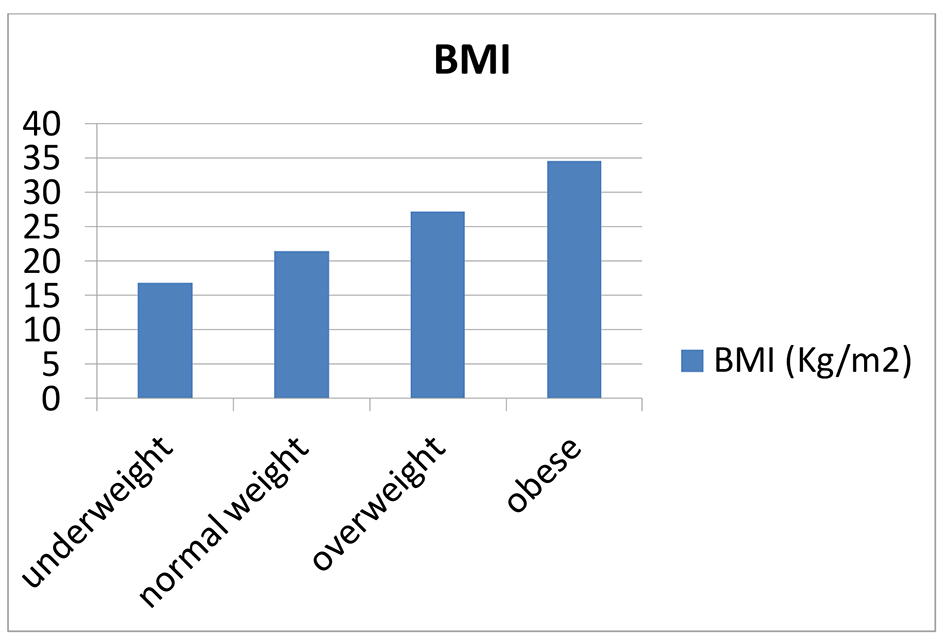
Figure 1. BMI.
| Journal of Clinical Medicine Research, ISSN 1918-3003 print, 1918-3011 online, Open Access |
| Article copyright, the authors; Journal compilation copyright, J Clin Med Res and Elmer Press Inc |
| Journal website http://www.jocmr.org |
Original Article
Volume 9, Number 6, June 2017, pages 520-524
Relationship Between Body Mass Index and Obesity Awareness in School Students
Figures
Tables
| Baseline characteristics (N = 528) | |
|---|---|
| Mean age (years) | 15.58 (SD 1.801) |
| Male (%) | 82.6 |
| Female (%) | 17.4 |
| High school students (%) | 46 |
| Intermediate school students (%) | 54 |
| Attending governmental school (%) | 86.9 |
| Mean height (m) | 1.62 (SD 0.11) |
| Mean weight (kg) | 59.80 (SD 19.85) |
| Mean BMI (kg/m2) | 22.37 (SD 6.006) |
| Mean waist circumference (cm) | 79.77 (SD 14.85) |
| Socioeconomic status | |
| Live with both parents (%) | 89.4 |
| Live in house they own (%) | 58 |
| Both parents working (%) | 27.3 |
| Lower level of education (father) (%) | 47.1 |
| Lower level of education (mother) (%) | 60.2 |
| Sleeping habits | |
| Less than 6 h sleeping/night (%) | 33.9 |
| More than 8 h sleeping/night (%) | 23 |
| Lifestyle habits | |
| Use electronic device daily (%) | 79.9 |
| TV in the bed room (%) | 46 |
| Eating and watch TV (%) | 68.6 |
| Play video game on a daily basis (%) | 28.8 |
| Dietary habit | |
| Daily breakfast eating (%) | 69.6 |
| Breakfast at home (%) | 38.3 |
| Lunch with family (%) | 87.8 |
| Dinner with family (%) | 85.2 |
| Eating fruit at least once daily (%) | 20.2 |
| Eating fast food on a daily basis (%) | 7 |
| Soft drinks at least once daily (%) | 32.7 |
| Physical activity | |
| Sedentary life style (%) | 37.6 |
| Practicing sports more than 300 min/week (%) | 17.1 |
| Transportation | |
| Walking to and from the school daily (%) | 28.8 |
| Smoking | |
| Active (%) | 5.9 |
| Passive (%) | 46.3 |
| ORK-10 scale | |
| Mean OKR-10 score (SD) | 3.15 (SD 1.9) |
| Aware (%) | 25.4 |
| Unaware (%) | 74.6 |
| Do you consider obesity as a disease? | |
| Yes (%) | 83.3 |
| No (%) | 16.7 |
| Baseline characteristic | Aware | Non-aware | P value |
|---|---|---|---|
| Students in the group (%) | 25.4 | 74.6 | n/a |
| Mean ORK-10 score | 5.6 (SD 0.8) | 2.3 (SD 1.4) | < 0.001 |
| Mean age (years) | 16.1(SD 1.8) | 15.4 (SD 1.8) | < 0.001 |
| Male (%) | 92.4 | 79.7 | < 0.001 |
| High school students (%) | 59.1 | 41.9 | 0.001 |
| Intermediate school students (%) | 40.9 | 58.1 | |
| Attending governmental school (%) | 76.5 | 90.4 | < 0.001 |
| Mean height (m) | 1.66 (SD 0.1) | 1.61 (0.11) | < 0.001 |
| Mean weight (kg) | 62.3 (SD 20.7) | 59.0 (SD 19.5) | 0.098 |
| Mean BMI (kg/m2) | 22.4 (SD 6.1) | 22.4 (SD 6.0) | 0.953 |
| Mean waist circumference (cm) | 80.7 (SD 13.6) | 79.5 (SD 15.3) | 0.395 |
| Socioeconomic | |||
| Live with both parents (%) | 92.4 | 88.3 | 0.808 |
| Live in house they own (%) | 53.8 | 59.3 | 0.264 |
| Both parents working (%) | 32.6 | 25.3 | 0.091 |
| Lower level of education (father) (%) | 48.5 | 46.6 | 0.947 |
| Lower level of education (mother) (%) | 52.7 | 62.7 | 0.265 |
| Sleeping habits | |||
| Less than 6 h sleeping/night (%) | 31.3 | 34.7 | 0.700 |
| More than 8 h sleeping/night (%) | 24.4 | 22.5 | |
| Lifestyle habits | |||
| Use electronic device daily (%) | 89.4 | 76.6 | 0.030 |
| TV in the bed room (%) | 47.3 | 45.5 | 0.930 |
| Eating and watch TV (%) | 66.7 | 69.0 | 0.555 |
| Play video game on a daily basis (%) | 28.8 | 28.8 | 0.261 |
| Dietary habits | |||
| Daily breakfast eating (%) | 66.7 | 70.9 | 0.207 |
| Breakfast at home (%) | 39.5 | 38.1 | 0.180 |
| Lunch with family (%) | 85.5 | 88.5 | 0.968 |
| Dinner with family (%) | 88.6 | 84.3 | 0.021 |
| Eating fruit at least daily (%) | 22.1 | 19.5 | 0.027 |
| Eating fast food on a daily basis (%) | 8.4 | 6.4 | 0.658 |
| Soft drinks at least once daily (%) | 29.5 | 33.9 | 0.687 |
| Physical activity | |||
| Sedentary life style (%) | 33.1 | 39.0 | 0.794 |
| Practicing sports more than 300 min/week (%) | 18.5 | 16.7 | |
| Transportation | |||
| Walking to and from the school daily (%) | 34.4 | 35.4 | 0.745 |
| Smoking | |||
| Active (%) | 8.4 | 5.1 | 0.379 |
| Passive (%) | 45.8 | 46.6 | 0.640 |
| Do you consider obesity as a disease? | |||
| Yes (%) | 92.4 | 80.7 | < 0.001 |
| Underweight | Normal weight | Overweight | Obese | P value | |
|---|---|---|---|---|---|
| Number of students (%) | 33.1 | 39.3 | 15.7 | 11.9 | n/a |
| Aware (%) | 25.5 | 26.4 | 22.7 | 25.4 | 0.629 |
| Consider obesity as a disease? | 80% | 84.1% | 88% | 84.1% | 0.650 |