Journal of Clinical Medicine Research, ISSN 1918-3003 print, 1918-3011 online, Open Access
Article copyright, the authors; Journal compilation copyright, J Clin Med Res and Elmer Press Inc
Journal website http://www.jocmr.org

Original Article

Volume 9, Number 4, April 2017, pages 332-338


Association of Whole Blood Viscosity With Metabolic Syndrome in Type 2 Diabetic Patients: Independent Association With Post-Breakfast Triglyceridemia

Figures

Figure 1.
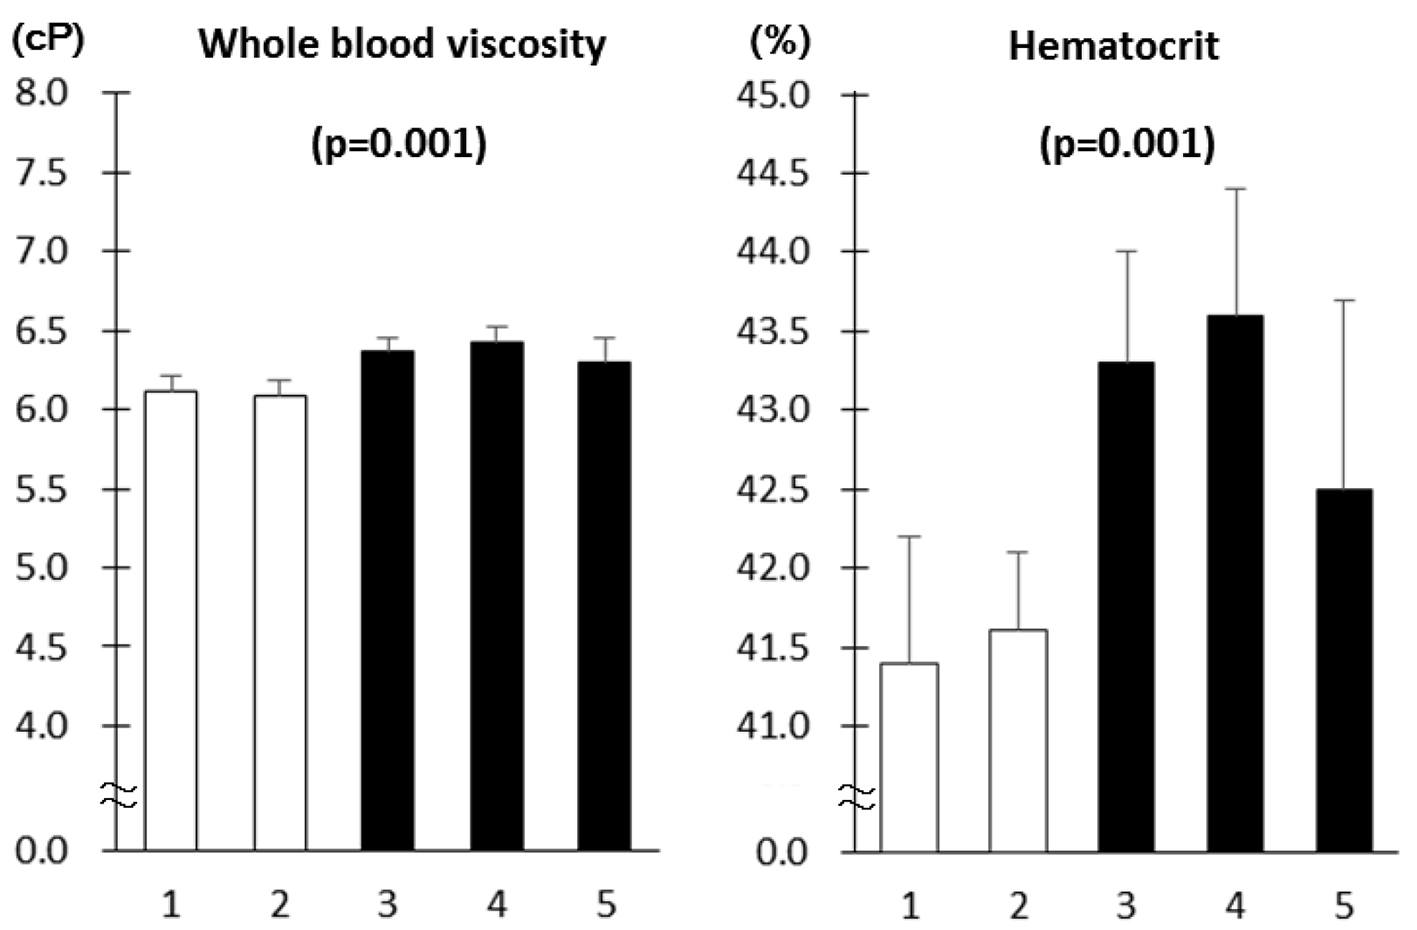
Figure 1. Whole blood viscosity and hematocrit in patients with type 2 diabetes as a function of the number of components of metabolic syndrome (mean ± SE). The number of patients with component number from 1 through to 5 is 33 (19.6%), 58 (34.5%), 42 (25.0%), 27 (16.1%) and 8 (4.8%), respectively. Associations of the number of MS components with WBV and hematocrit and P values for trend were derived using Jonckheere-Terpstra test.
Figure 2.
Figure 2. Whole blood viscosity and hematocrit in type 2 diabetes patients in the absence (white columns, n = 91) and presence (black columns, n = 77) of metabolic syndrome (mean ± SE).

Tables

Table 1. Anthropometric, Clinical and Biochemical Characteristics of 168 Patients With Type 2 Diabetes and Correlation Coefficients of Whole Blood Viscosity Before (Simple) and After (Partial) Adjustment for Sex
 
VariablesMean ± SE or n, %WBV
SimplePartial
WBV: whole blood viscosity; PG: plasma glucose; TG: triglycerides; ACR: albumin/creatinine ratio; eGFR: estimated glomerular filtration rate; AST: aspartate aminotransferase; ALT: alanine aminotransferase; GGT: gamma-glutamyl transferase; BP: blood pressure. *P < 0.05, **P < 0.01.
Male (n, %)90 (53.6)-0.447**Adjusted
Age (years)62.3 ± 0.8-0.101-0.002
BMI (kg/m2)24.2 ± 0.30.1060.238**
Waist circumference (cm)86.9 ± 0.80.0780.184**
Duration of diabetes (years)9.9 ± 0.60.0180.031
Smokers (n, %)58 (34.3)0.225**-0.017
Whole blood viscosity (cP)5.95 ± 0.041.0001.000
Fasting PG (mg/dL)125 ± 20.011-0.001
Post-breakfast PG (mg/dL)154 ± 40.025-0.077
HbA1c (%)7.0 ± 0.50.0460.055
Total cholesterol (mg/dL)188 ± 2-0.0110.147
HDL cholesterol (mg/dL)56 ± 1-0.189*-0.123
LDL cholesterol (mg/dL)111 ± 2-0.0070.080
Fasting TG (mg/dL)115 ± 40.199*0.225**
Post-breakfast TG (mg/dL)145 ± 50.230**0.222**
ACR (mg/g)84 ± 25-0.0310.018
Log ACR1.30 ± 0.050.0210.085
eGFR (mL/min/1.73 m2)75.8 ± 1.30.064-0.019
Uric acid (mg/dL)5.2 ± 0.10.21**0.084
Systolic BP (mm Hg)128 ± 1-0.0040.051
Diastolic BP (mm Hg)72 ± 10.32**0.249**
Serum protein (g/dL)7.2 ± 0.030.213**0.221**
AST (U/L)24.4 ± 10.188*0.067
ALT (U/L)24 ± 10.256**0.129
GGT (U/L)46 ± 40.167*0.051
White blood cells (× 103/µL)5.8 ± 0.10.169*0.145
Red blood cell (× 106/µL)451 ± 40.775**0.691**
Hemoglobin (g/dL)14.0 ± 0.10.764**0.864**
Hematocrit (%)42.3 ± 0.30.994**0.993**


Table 2. Multiple Regression Analysis for Whole Blood Viscosity in Patients With Type 2 Diabetes
 
Standardized βP valuesCumulative R2
Other independent variables included in the model were BMI, waist circumference and fasting triglycerides, all of which showed significant associations with whole blood viscosity after controlling for sex shown in Table 1.
Male sex0.4060.0000.183
Diastolic blood pressure0.2340.0010.240
Post-breakfast triglyceride0.1480.0360.258