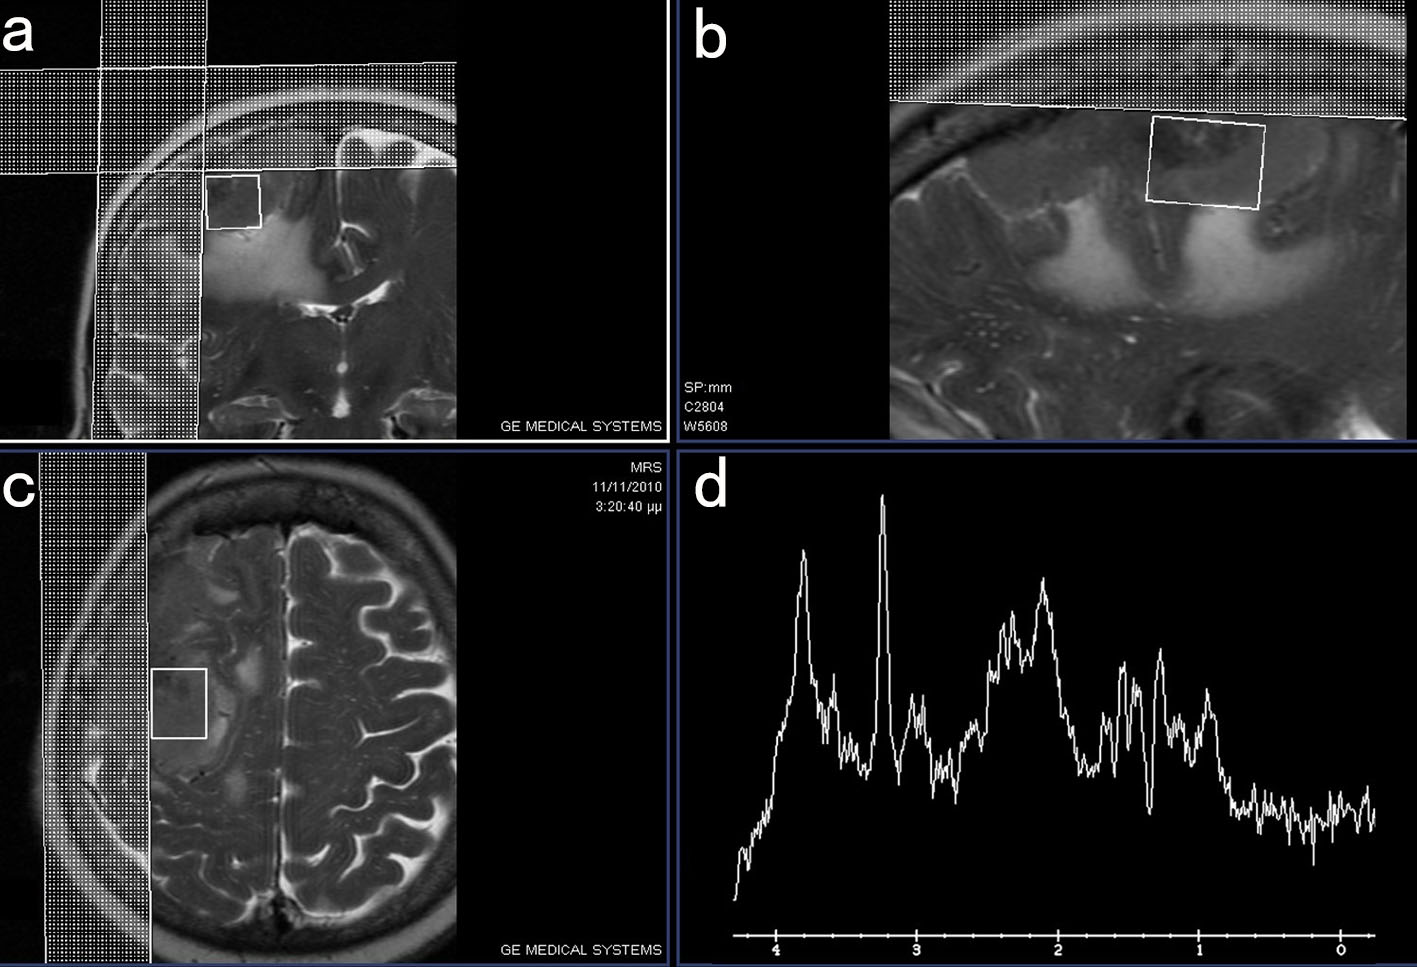
Figure 1. MRI images in coronal (a), sagittal (b) and axial plane (c) demonstrating the area of the tumor where the voxel of the performed MRS study (d) was obtained.
| Journal of Clinical Medicine Research, ISSN 1918-3003 print, 1918-3011 online, Open Access |
| Article copyright, the authors; Journal compilation copyright, J Clin Med Res and Elmer Press Inc |
| Journal website http://www.jocmr.org |
Case Report
Volume 9, Number 1, January 2017, pages 74-78
Magnetic Resonance Spectroscopy and Single-Photon Emission Computed Tomography in the Evaluation of Cerebral Tumors: A Case Report
Figures
Table
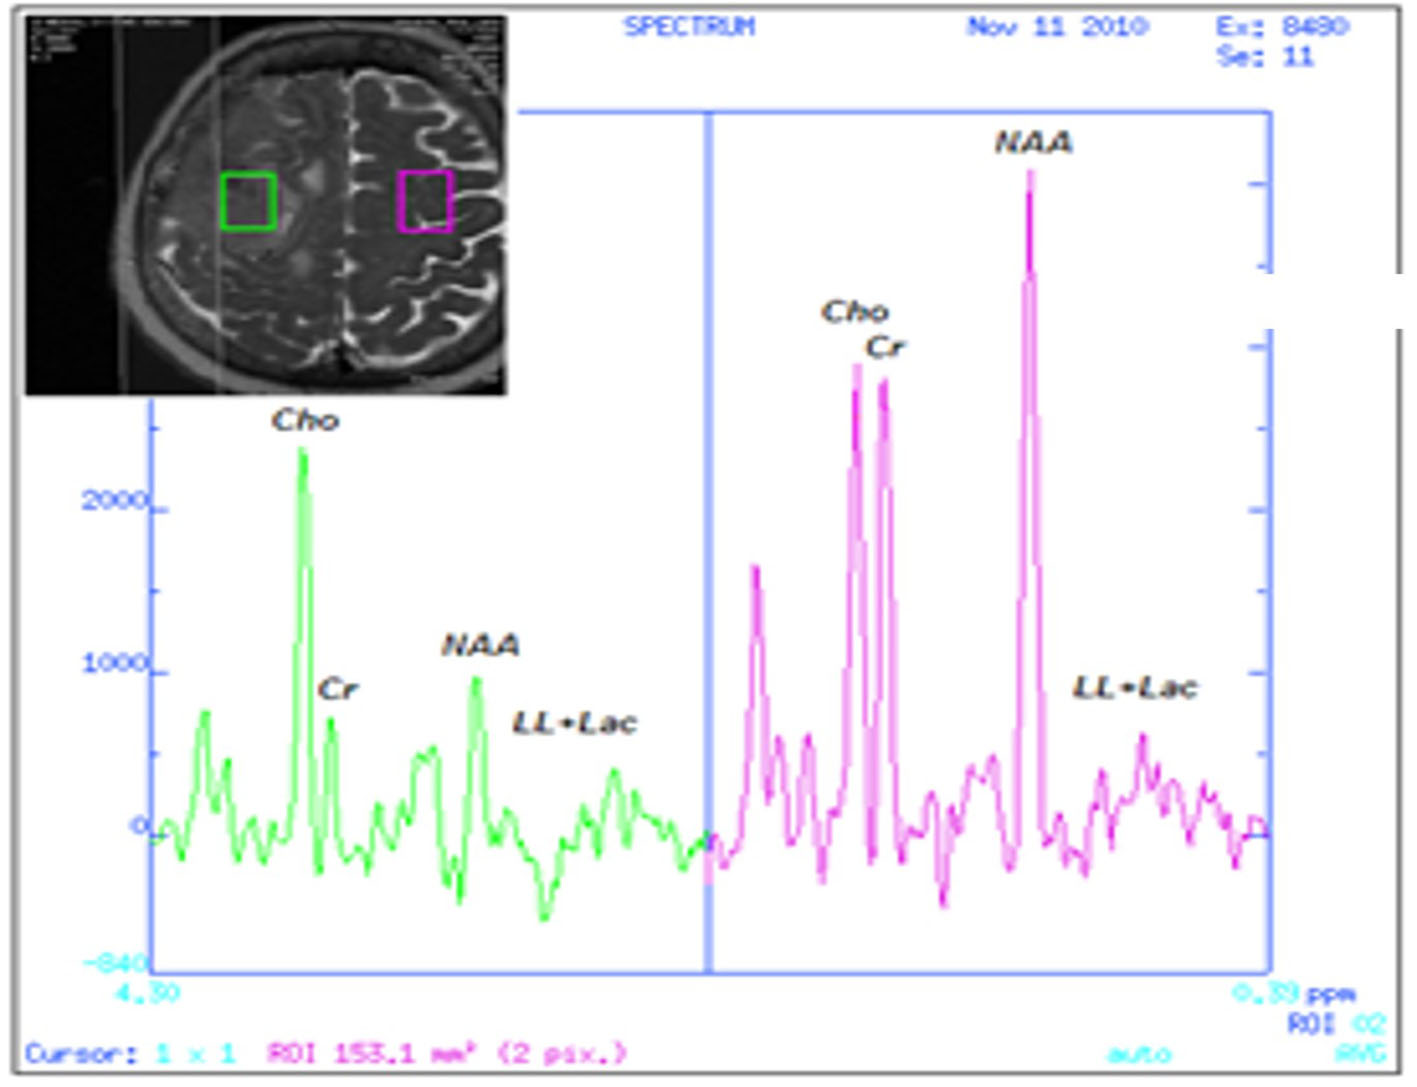
| Lesion site (right hemisphere) | Normal brain tissue (left hemisphere) | Deviation | |
|---|---|---|---|
| Chol: choline; Cr: creatinine; NAA: N-acetylaspartate. | |||
| NAA/Cr | 1.56 | 1.63 | (-) 4 |
| Chol/Cr | 4.05 | 1.15 | (+) 252 |
| Chol/NAA | 2.03 | 0.709 | (+) 186 |