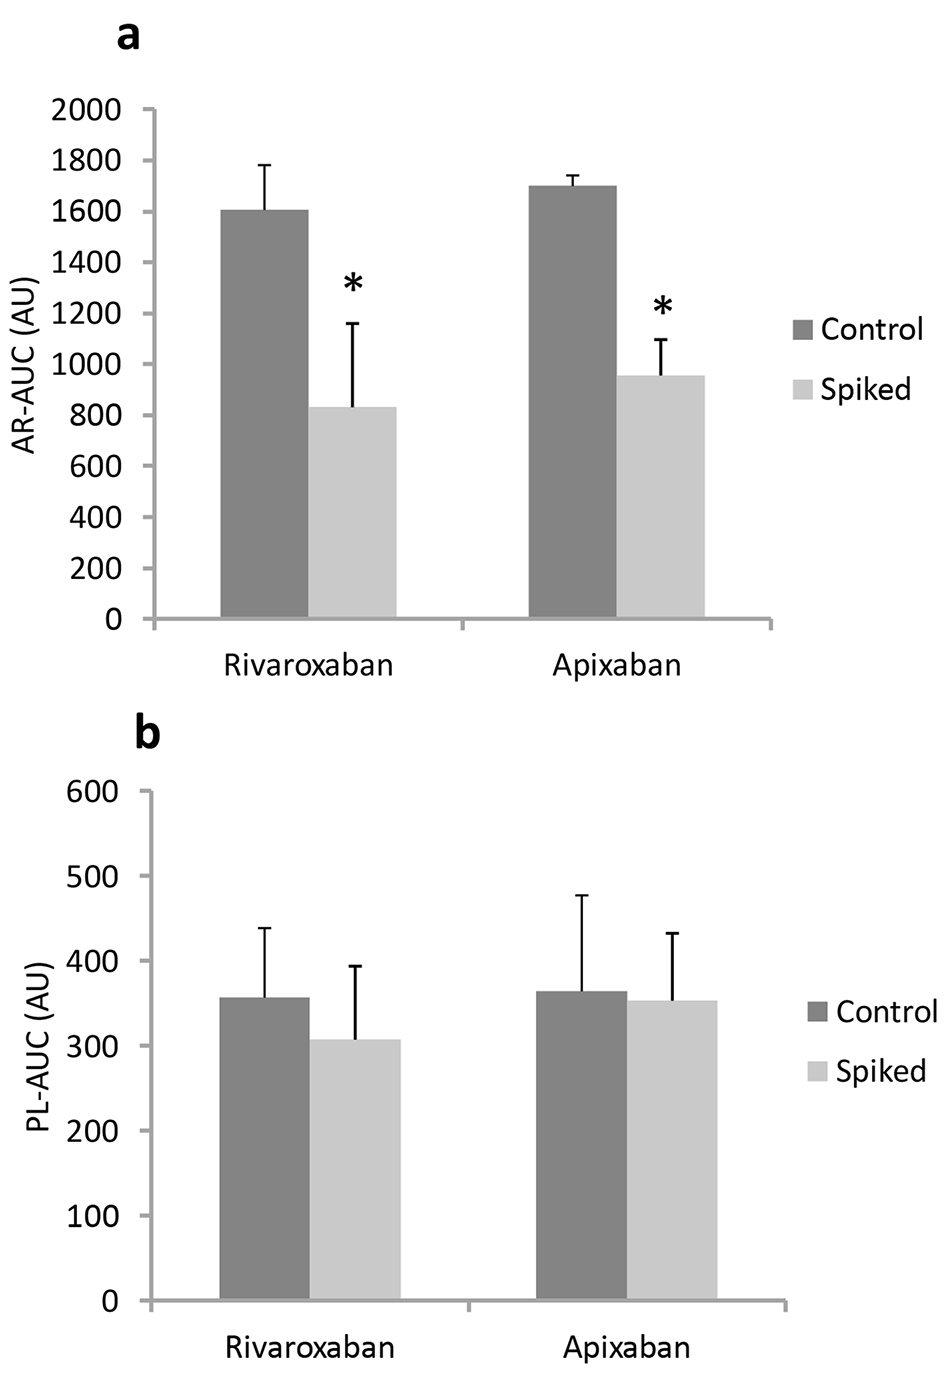
Figure 1. In vitro antithrombotic effects (AR-AUC (a) and PL-AUC (b)) in the absence of (control) or presence of (spiked) rivaroxaban and apixaban in blood from healthy volunteers using AR-chips and PL-chips. *P < 0.05 vs. control.
| Journal of Clinical Medicine Research, ISSN 1918-3003 print, 1918-3011 online, Open Access |
| Article copyright, the authors; Journal compilation copyright, J Clin Med Res and Elmer Press Inc |
| Journal website http://www.jocmr.org |
Original Article
Volume 8, Number 12, December 2016, pages 899-907
Evaluation of the Antithrombotic Effects of Rivaroxaban and Apixaban Using the Total Thrombus-Formation Analysis System®: In Vitro and Ex Vivo Studies
Figures
Tables
| Rivaroxaban (n = 16) | Apixaban (n = 4) | |||
|---|---|---|---|---|
| Control | Spiked | Control | Spiked | |
| Continuous variables are expressed as mean ± SD. *P < 0.05 vs. control. | ||||
| AR-T10 (min) | 7.9 ± 2.2 | 16.1 ± 4.5* | 6.7 ± 0.2 | 14.0 ± 1.3* |
| AR-T80 (min) | 12.4 ± 2.4 | 22.6 ± 3.2* | 11.4 ± 1.1 | 22.6 ± 2.2* |
| PL-T10 (min) | 2.3 ± 0.7 | 2.9 ± 0.7 | 2.2 ± 1.1 | 2.8 ± 0.7 |
| PL-T60 (min) | 6.0 ± 1.7 | 6.6 ± 1.3 | 6.2 ± 2.6 | 6.2 ± 1.5 |
| All | Rivaroxaban | Apixaban | |
|---|---|---|---|
| Continuous variables are expressed as mean ± SD. IN/TN: incidence number/total number of subjects; BMI: body mass index; HTN: hypertension; DL: dyslipidemia; DM: diabetes mellitus; AF: atrial fibrillation; eGFR: estimated glomerular filtration rate; Ht: hematocrit; Plt: platelet counts; ARB/ACE-I: angiotensin II receptor blocker/angiotensin converting enzyme inhibitor. †P < 0.05 vs. rivaroxaban group. | |||
| N | 16 | 6 | 10 |
| Age, years | 68 ± 9 | 67 ± 10 | 69 ± 9 |
| Male, IN/TN (%) | 10/16 (63) | 5/6 (83) | 5/10 (50)† |
| BMI, kg/m2 | 24 ± 3 | 24 ± 4 | 23 ± 4 |
| HTN, IN/TN (%) | 12/16 (75) | 4/6 (67) | 8/10 (80) |
| DL, IN/TN (%) | 10/16 (63) | 2/6 (33) | 8/10 (80)† |
| DM, IN/TN (%) | 4/16 (25) | 1/6 (17) | 3/10 (30) |
| eGFR, mL/min/1.73 m2 | 55.6 ± 11.6 | 56.4 ± 12.7 | 52.1 ± 10.0 |
| Ht, % | 39.6 ± 3.3 | 39.5 ± 2.7 | 39.7 ± 3.8 |
| Plt, 104/μL | 19.7 ± 6.1 | 21.7 ± 6.1 | 17.2 ± 3.7 |
| Medication | |||
| ARB/ACE-I, IN/TN (%) | 11/16 (69) | 4/6 (67) | 7/10 (70) |
| Beta blocker, IN/TN (%) | 7/16 (44) | 3/6 (50) | 4/10 (40) |
| Diuretic, IN/TN (%) | 4/16 (25) | 2/6 (33) | 2/10 (20) |
| Statin, IN/TN (%) | 9/16 (56) | 2/6 (33) | 7/10 (70) |
| Rivaroxaban (n = 6) | Apixaban (n = 10) | |||
|---|---|---|---|---|
| Trough | Peak | Trough | Peak | |
| Continuous variables are expressed as mean ± SD. *P < 0.05 vs. trough, †P < 0.05 vs. rivaroxaban group. | ||||
| AR-T10 (min) | 9.2 ± 2.9 | 12.3 ± 2.3 | 11.9 ± 2.5 | 15.5 ± 3.2* |
| AR-T80 (min) | 13.7 ± 3.2 | 18.3 ± 3.5* | 18.3 ± 3.1† | 22.0 ± 3.3* |
| PL-T10(min) | 2.4 ± 0.7 | 2.4 ± 1.5 | 2.9 ± 1.3 | 3.5 ± 1.0 |
| PL-T60 (min) | 6.7 ± 1.3 | 6.2 ± 0.8 | 8.3 ± 0.8 | 8.0 ± 0.3 |
| PT-INR | 1.2 ± 0.2 | 1.3 ± 0.2 | 1.1 ± 0.1 | 1.2 ± 0.1 |
| APTT (s) | 34.4 ± 5.3 | 40.7 ± 14.3 | 31.4 ± 2.3 | 31.9 ± 2.8 |