Journal of Clinical Medicine Research, ISSN 1918-3003 print, 1918-3011 online, Open Access
Article copyright, the authors; Journal compilation copyright, J Clin Med Res and Elmer Press Inc
Journal website http://www.jocmr.org

Original Article

Volume 8, Number 12, December 2016, pages 863-869


Effect of L-Carnitine in Patients With Liver Cirrhosis on Energy Metabolism Using Indirect Calorimetry: A Pilot Study

Figures

Figure 1.
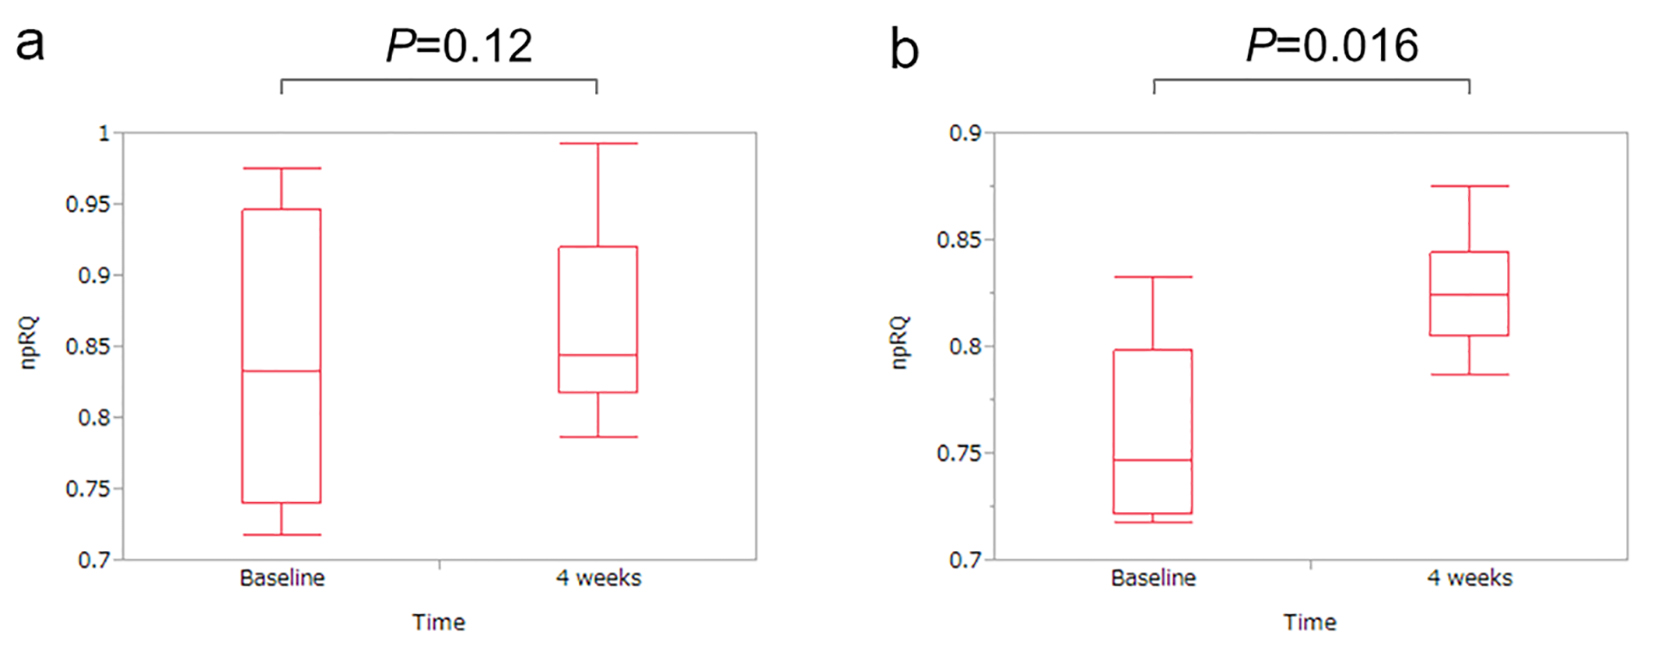
Figure 1. Changes in the non-protein respiratory quotient (npRQ) before and after 4 weeks of L-carnitine therapy. (a) For all cases (n = 13), the npRQ value at 4 weeks increased as compared with the baseline levels, although the difference was not significant (P = 0.12). (b) In patients with baseline npRQ < 0.85 (n = 7), the npRQ value significantly increased as compared with the baseline levels after 4 weeks of L-carnitine treatment (P = 0.016).
Figure 2.
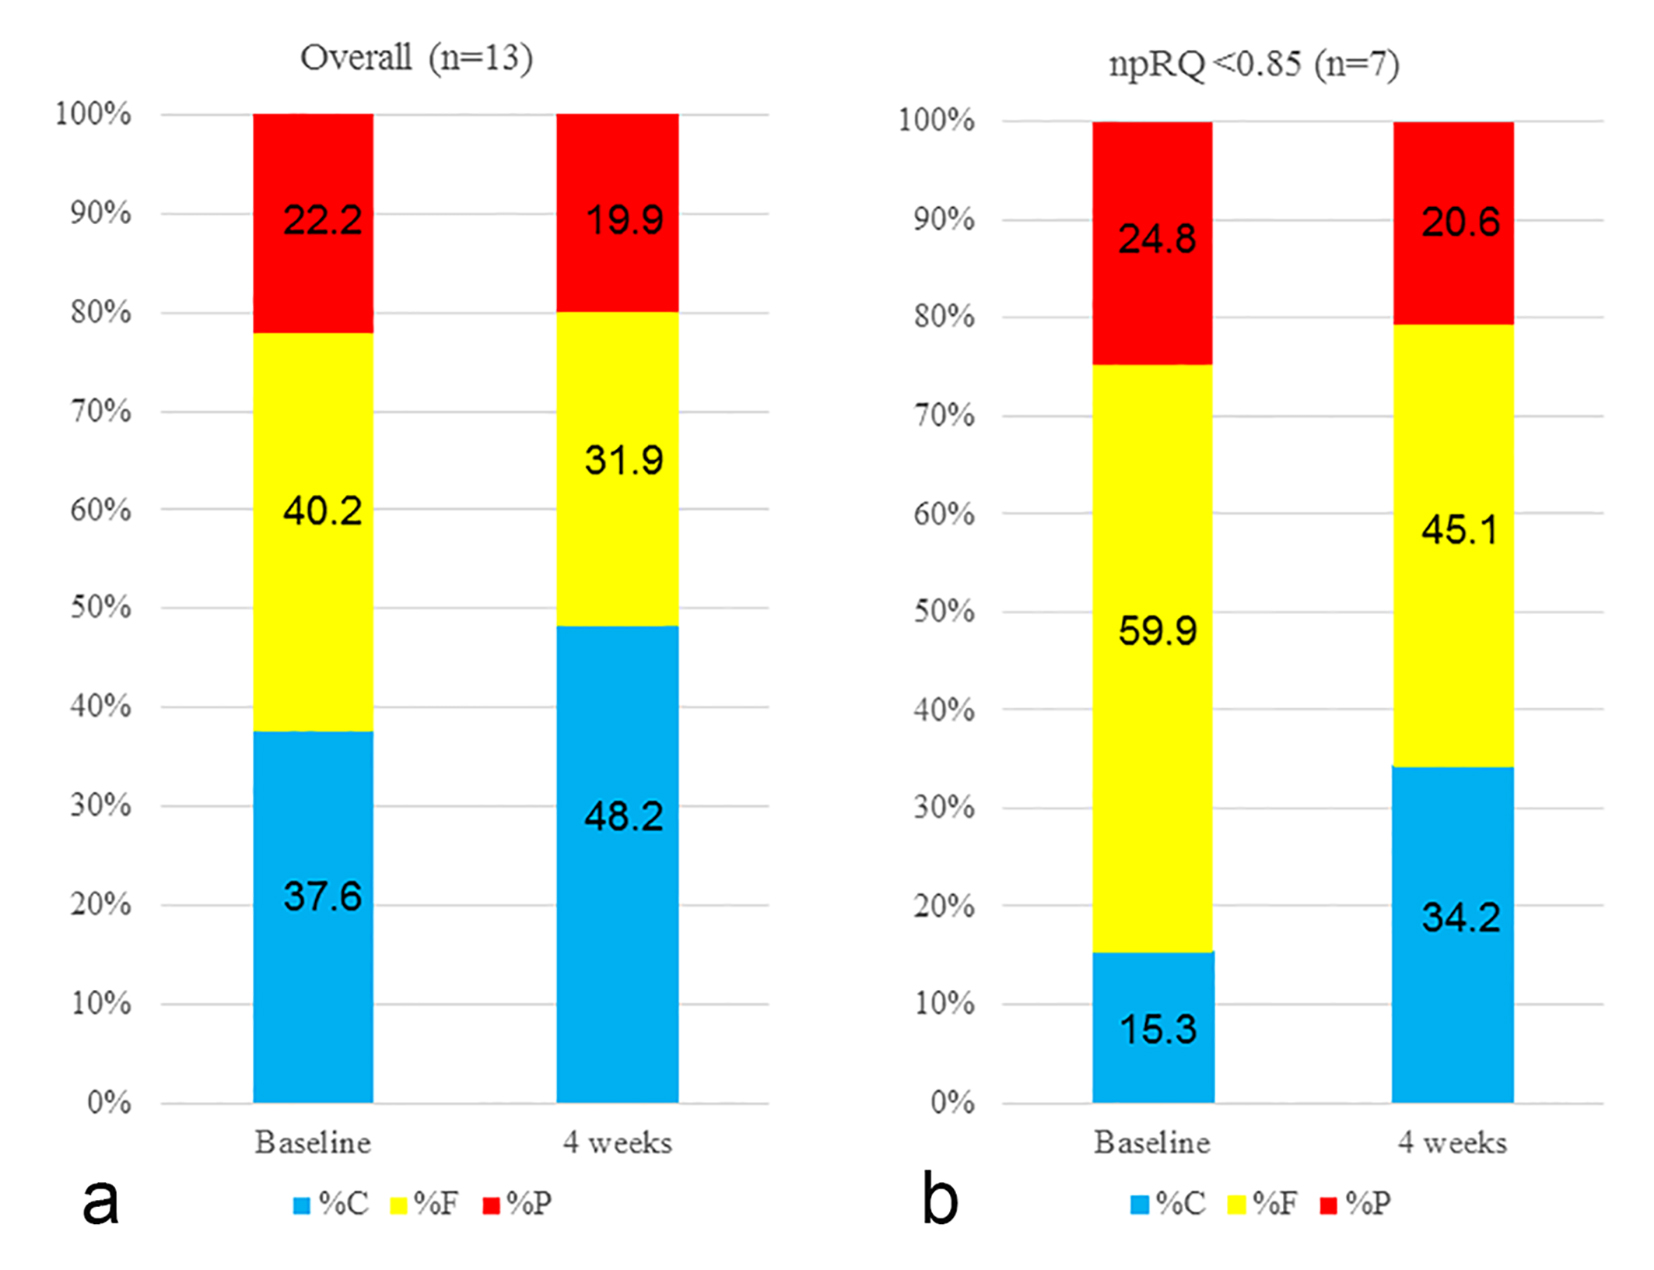
Figure 2. Changes in energy metabolism before and after L-carnitine therapy. (a) For all cases, the mean %C was 37.6%, the mean %F was 40.2% and the mean %P was 22.2% at the time of L-carnitine therapy. After 4 weeks of L-carnitine therapy, the mean %C increased to 48.2%, the mean %F decreased to 31.9% and the mean %P decreased to 19.9%, which indicated an improvement in energy metabolism. (b) In a subgroup analysis of patients with baseline npRQ < 0.85, the mean %C was 15.3%, the mean %F was 59.9% and the mean %P was 24.8% at the time of L-carnitine therapy. After 4 weeks of L-carnitine therapy, the mean %C increased to 34.2%, the mean %F decreased to 45.1% and the mean %P decreased to 20.6%, suggesting an improvement in energy metabolism. Data are expressed as mean values.
Figure 3.
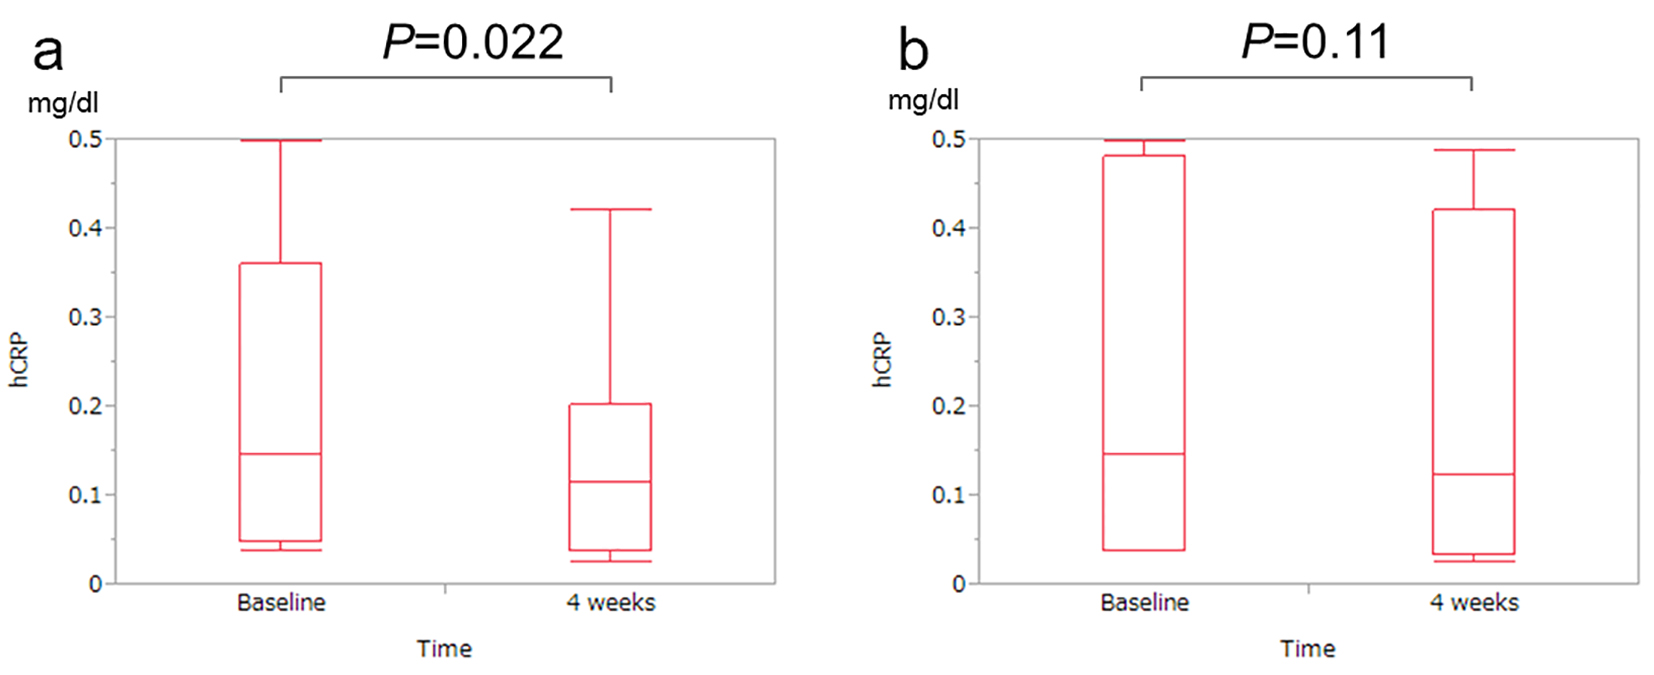
Figure 3. Changes in high-sensitivity C-reactive protein (hsCRP) levels between baseline and 4 weeks. (a) For all patients, the hsCRP level at 4 weeks significantly decreased as compared with the hsCRP level at baseline (P = 0.022). (b) In patients with a npRQ value < 0.85, the hsCRP level at 4 weeks tended to decrease as compared with the hsCRP level at baseline (P = 0.11).

Tables

Table 1. Changes of Parameters Before and After 4 Weeks of L-Carnitine Therapy (n = 13)
 
VariablesBaselineAt 4 weeksP valuea
Data are presented as mean ± standard deviation. %C: substrate oxidation rates of carbohydrate; %F: substrate oxidation rates of fat; %P: substrate oxidation rates of protein; BCAA: branched chain amino acid; IRI: immune reactive insulin; HOMA-IR: homeostasis model assessment-insulin resistance. aPaired t-test.
Total carnitine (μmol/L)71.0 ± 14.7105.5 ± 30.0< 0.001
Free carnitine (μmol/L)54.5 ± 13.877.9 ± 23.1< 0.001
Acyl carnitine (μmol/L)16.5 ± 3.927.6 ± 9.0< 0.001
Non-protein respiratory quotient0.838 ± 0.0970.868 ± 0.0600.19
Rest energy expenditure (kcal/day)1,402.4 ± 239.11,379.9 ± 265.30.33
%C37.6 ± 30.048.2 ± 18.30.12
%F40.2 ± 26.631.9 ± 23.70.20
%P22.2 ± 15.319.9 ± 15.90.48
Free fatty acid (μEq/L)669.6 ± 198.1846.2 ± 192.50.003
Total cholesterol (mg/dL)171.8 ± 43.3177.2 ± 45.50.16
Triglyceride (mg/dL)66.1 ± 25.370.4 ± 33.80.19
Body weight (kg)62.7 ± 13.663.0 ± 13.80.09
Serum albumin (g/dL)3.22 ± 0.503.29 ± 0.580.32
Serum prealbumin (mg/dL)9.85 ± 2.7410.12 ± 3.330.41
BCAA to tyrosine ratio3.16 ± 0.873.35 ± 1.140.49
Fasting blood glucose (mg/dL)111.5 ± 19.2113.2 ± 19.20.57
IRI (μU/mL)14.6 ± 10.212.1 ± 7.50.17
HOMA-IR3.97 ± 2.753.36 ± 2.040.23
Serum ammonia (μg/dL)65.8 ± 49.161.4 ± 45.40.53


Table 2. Changes of Parameters Before and After 4 Weeks of L-Carnitine Therapy in Patients With npRQ < 0.85 (n = 7)
 
VariablesBaselineAt 4 weeksP valuea
Data are presented as mean ± standard deviation. %C: substrate oxidation rates of carbohydrate; %F: substrate oxidation rates of fat; %P: substrate oxidation rates of protein; BCAA: branched chain amino acid; IRI: immune reactive insulin; HOMA-IR: homeostasis model assessment-insulin resistance. aPaired t-test.
Total carnitine (μmol/L)65.9 ± 16.5107.3 ± 33.90.001
Free carnitine (μmol/L)49.2 ± 15.976.5 ± 25.70.001
Acyl carnitine (μmol/L)16.7 ± 3.030.8 ± 10.30.006
Non-protein respiratory quotient0.760 ± 0.0430.827 ± 0.0300.016
Rest energy expenditure (kcal/day)1,368.1 ± 195.21,312.8 ± 311.50.25
%C15.3 ± 15.434.2 ± 6.70.019
%F59.9 ± 16.945.1 ± 21.70.073
%P24.8 ± 17.320.6 ± 20.50.49
Free fatty acid (μEq/L)761.0 ± 147.7909.6 ± 136.60.069
Total cholesterol (mg/dL)184.4 ± 44.3185 ± 48.00.92
Triglyceride (mg/dL)65.1 ± 19.465.4 ± 21.10.92
Body weight (kg)57.1 ± 14.857.2 ± 14.70.67
Serum albumin (g/dL)3.06 ± 0.393.06 ± 0.36> 0.99
Serum prealbumin (mg/dL)9.1 ± 3.09.5 ± 4.00.45
BCAA to tyrosine ratio2.97 ± 0.723.33 ± 1.420.47
Fasting blood glucose (mg/dL)111.7 ± 25.5116.4 ± 22.80.34
IRI (μU/mL)9.3 ± 4.79.3 ± 4.30.93
HOMA-IR2.51 ± 1.232.67 ± 1.230.43
Serum ammonia (μg/dL)48.3 ± 33.441.6 ± 16.60.51