Figures
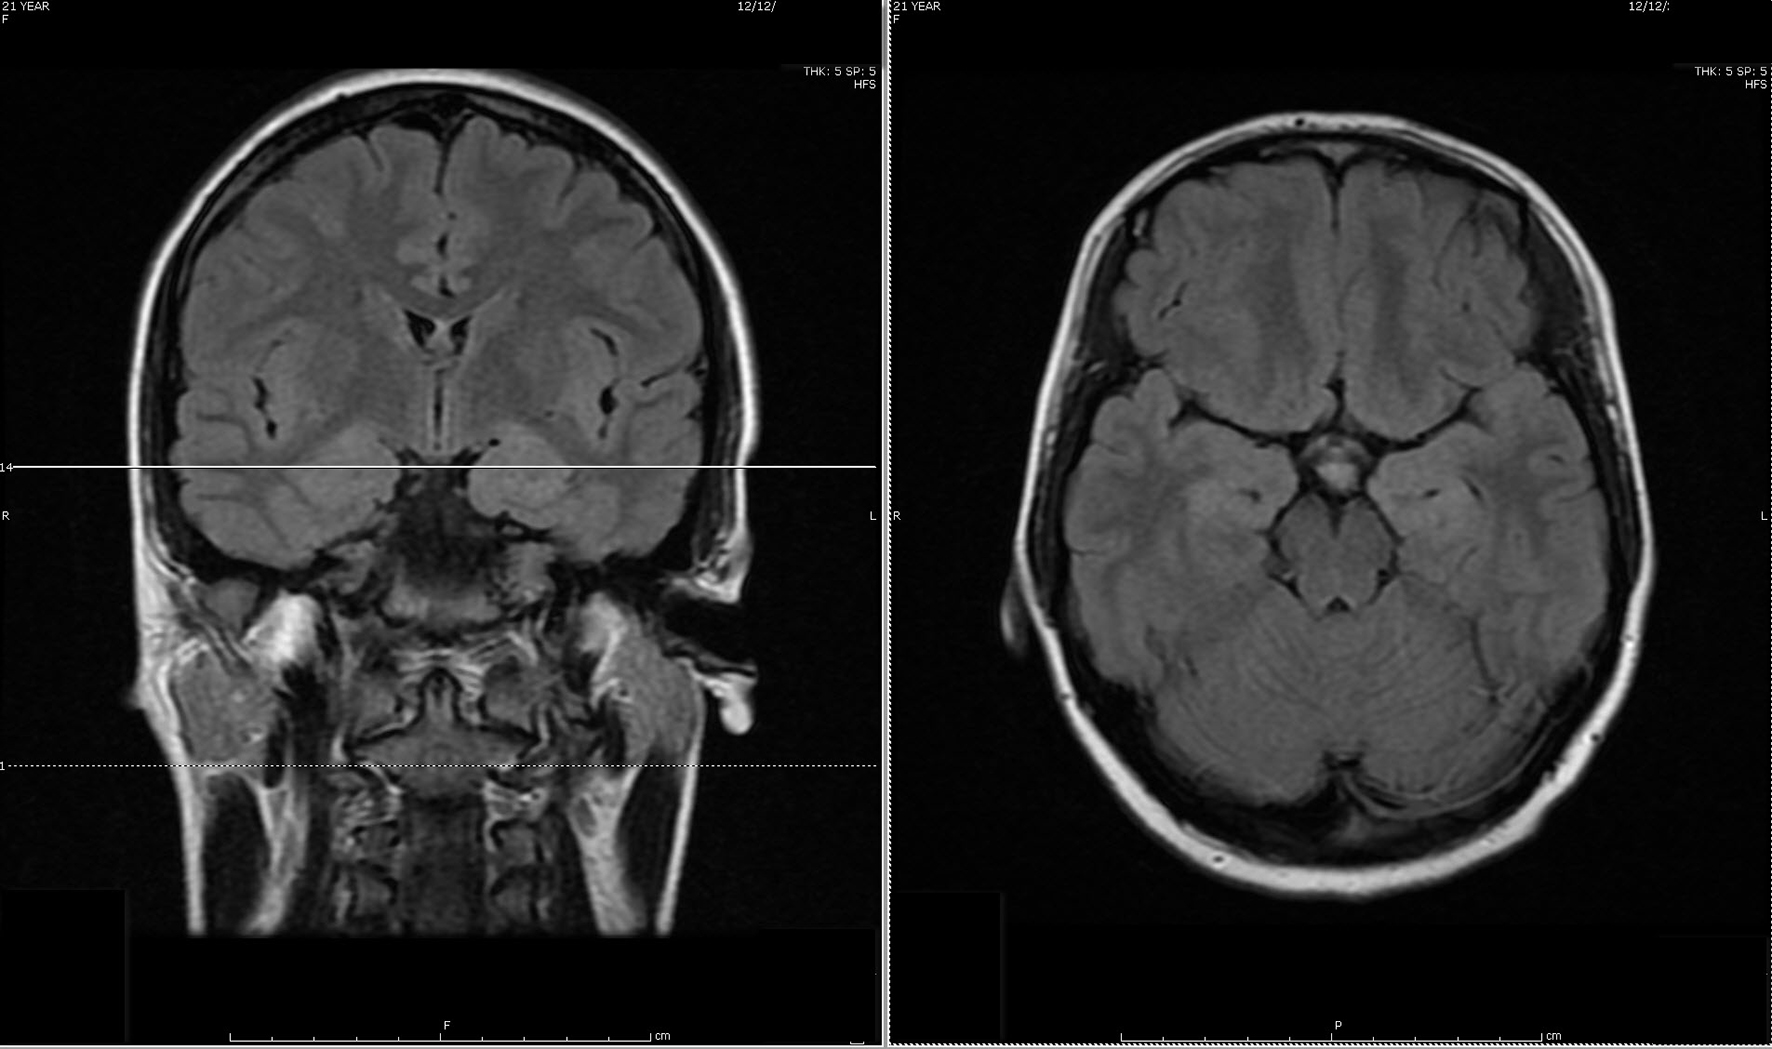
Figure 1. Initial MRI of brain showed subtle increased signal intensity on coronal and axial FLAIR MR sequences in the bilateral hippocampus, amygdala, fornix and mammillary body.
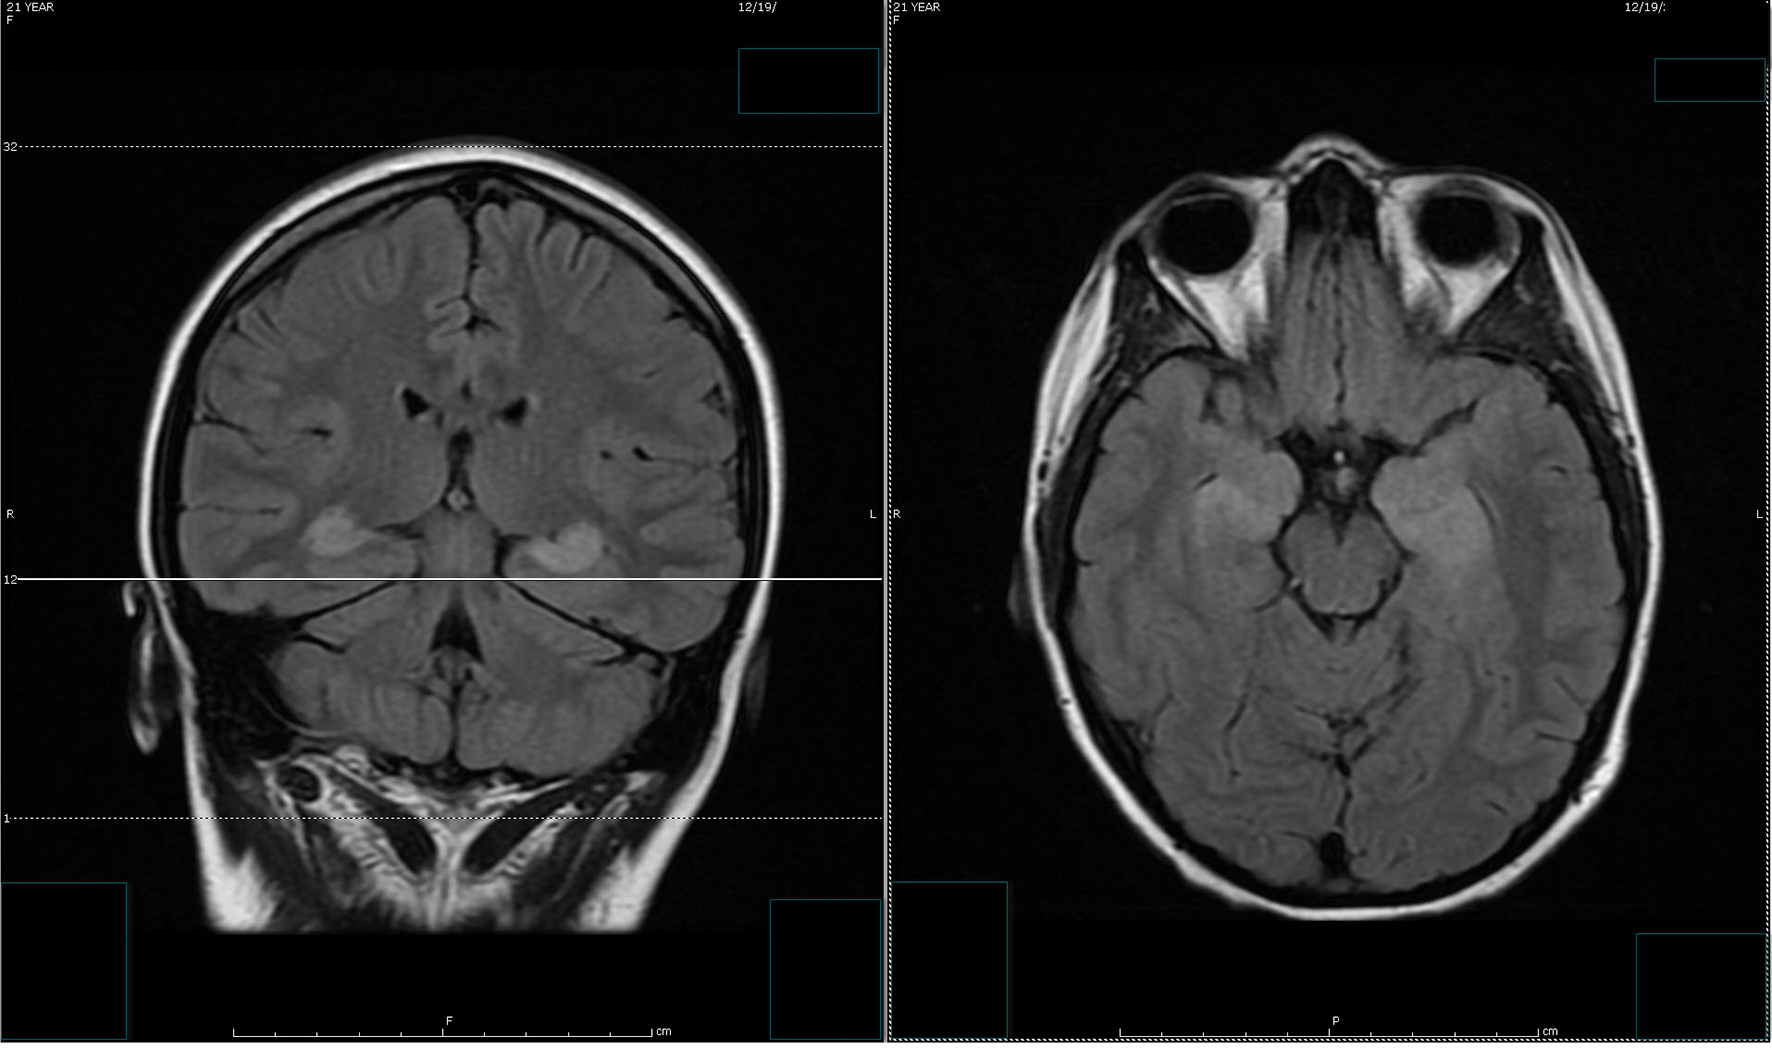
Figure 2. The follow-up MRI of brain showed interval increase in the extent of T2 signal intensity in the bilateral hippocampus, amygdala, fornix and mammillary body on fluid-attenuated inversion recovery (FLAIR) sequences. MRI obtained in Figure 1 and Figure 2 was 1 week apart.
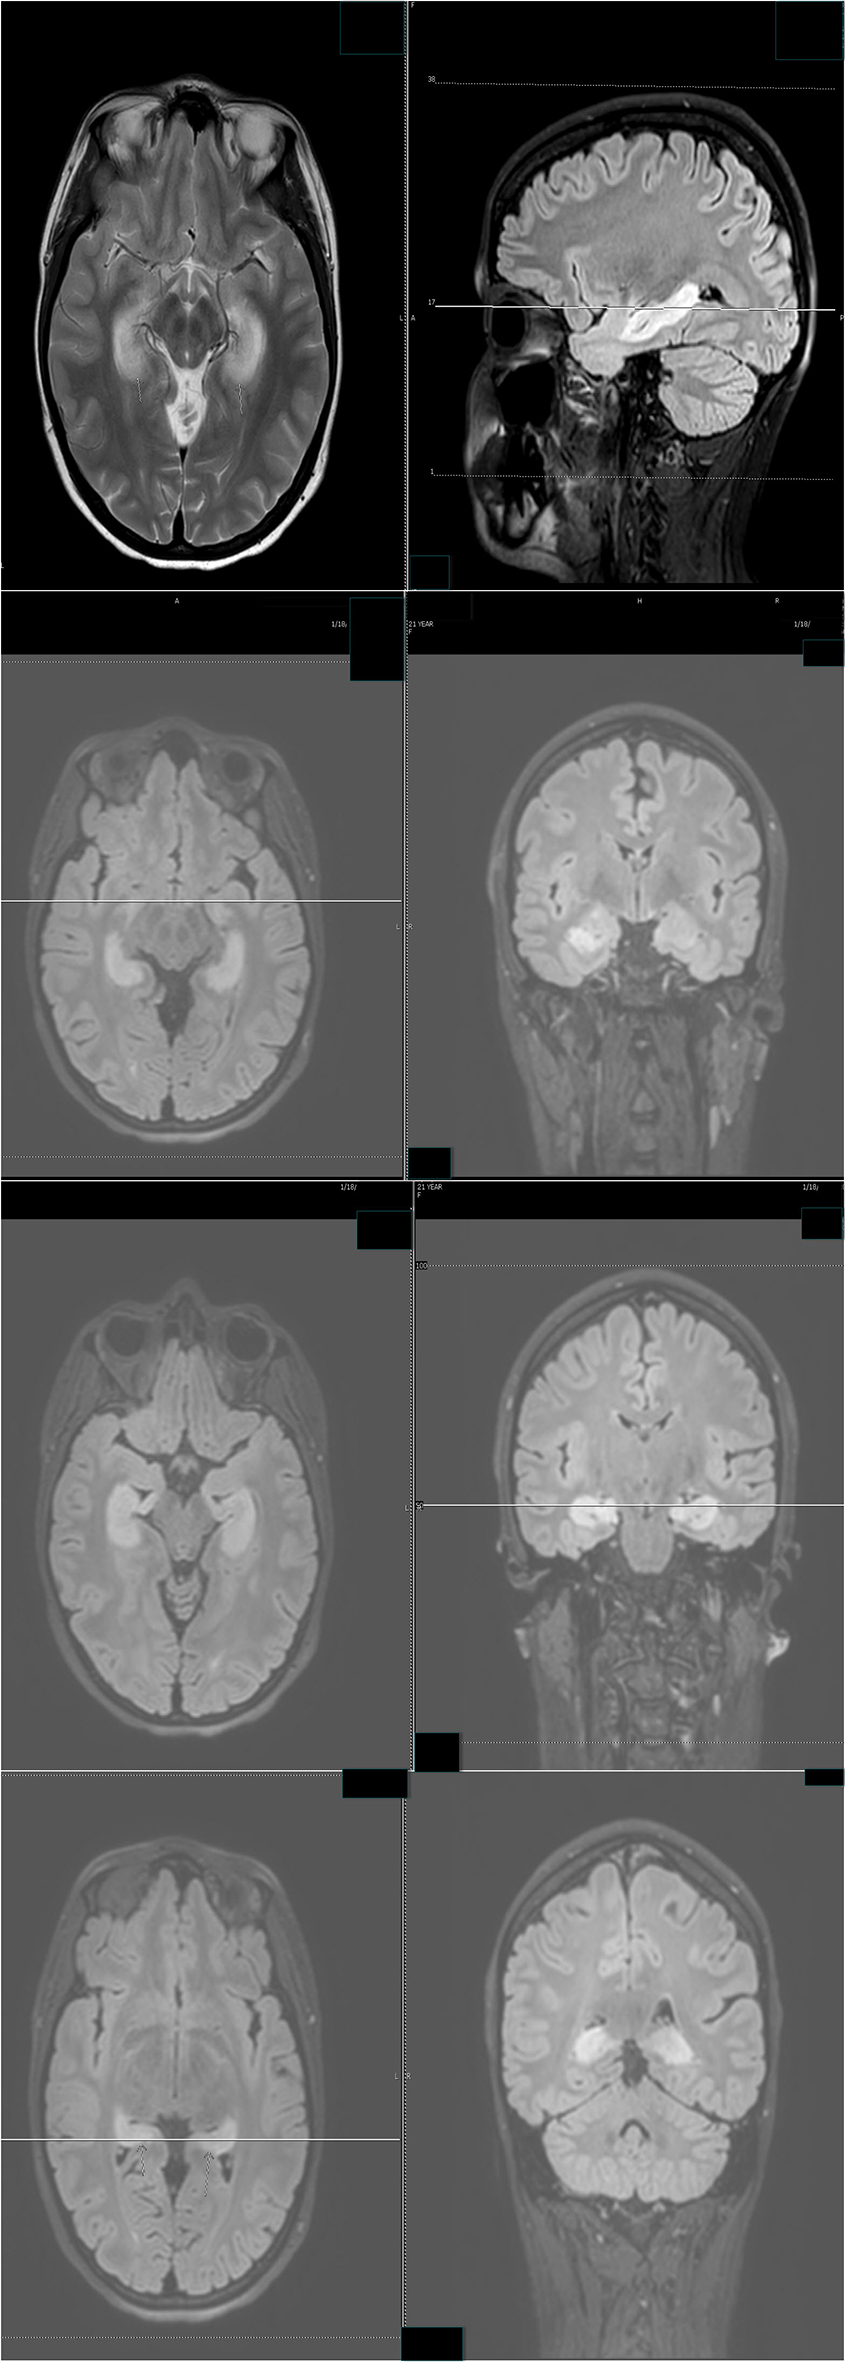
Figure 3. The follow-up MRI of brain showed significant interval increase in the extent of T2 signal intensity in the bilateral hippocampus, amygdala, fornix and mammillary body on fluid-attenuated inversion recovery (FLAIR) sequences. MRI obtained in Figure 2 and Figure 3 was 1 month apart.
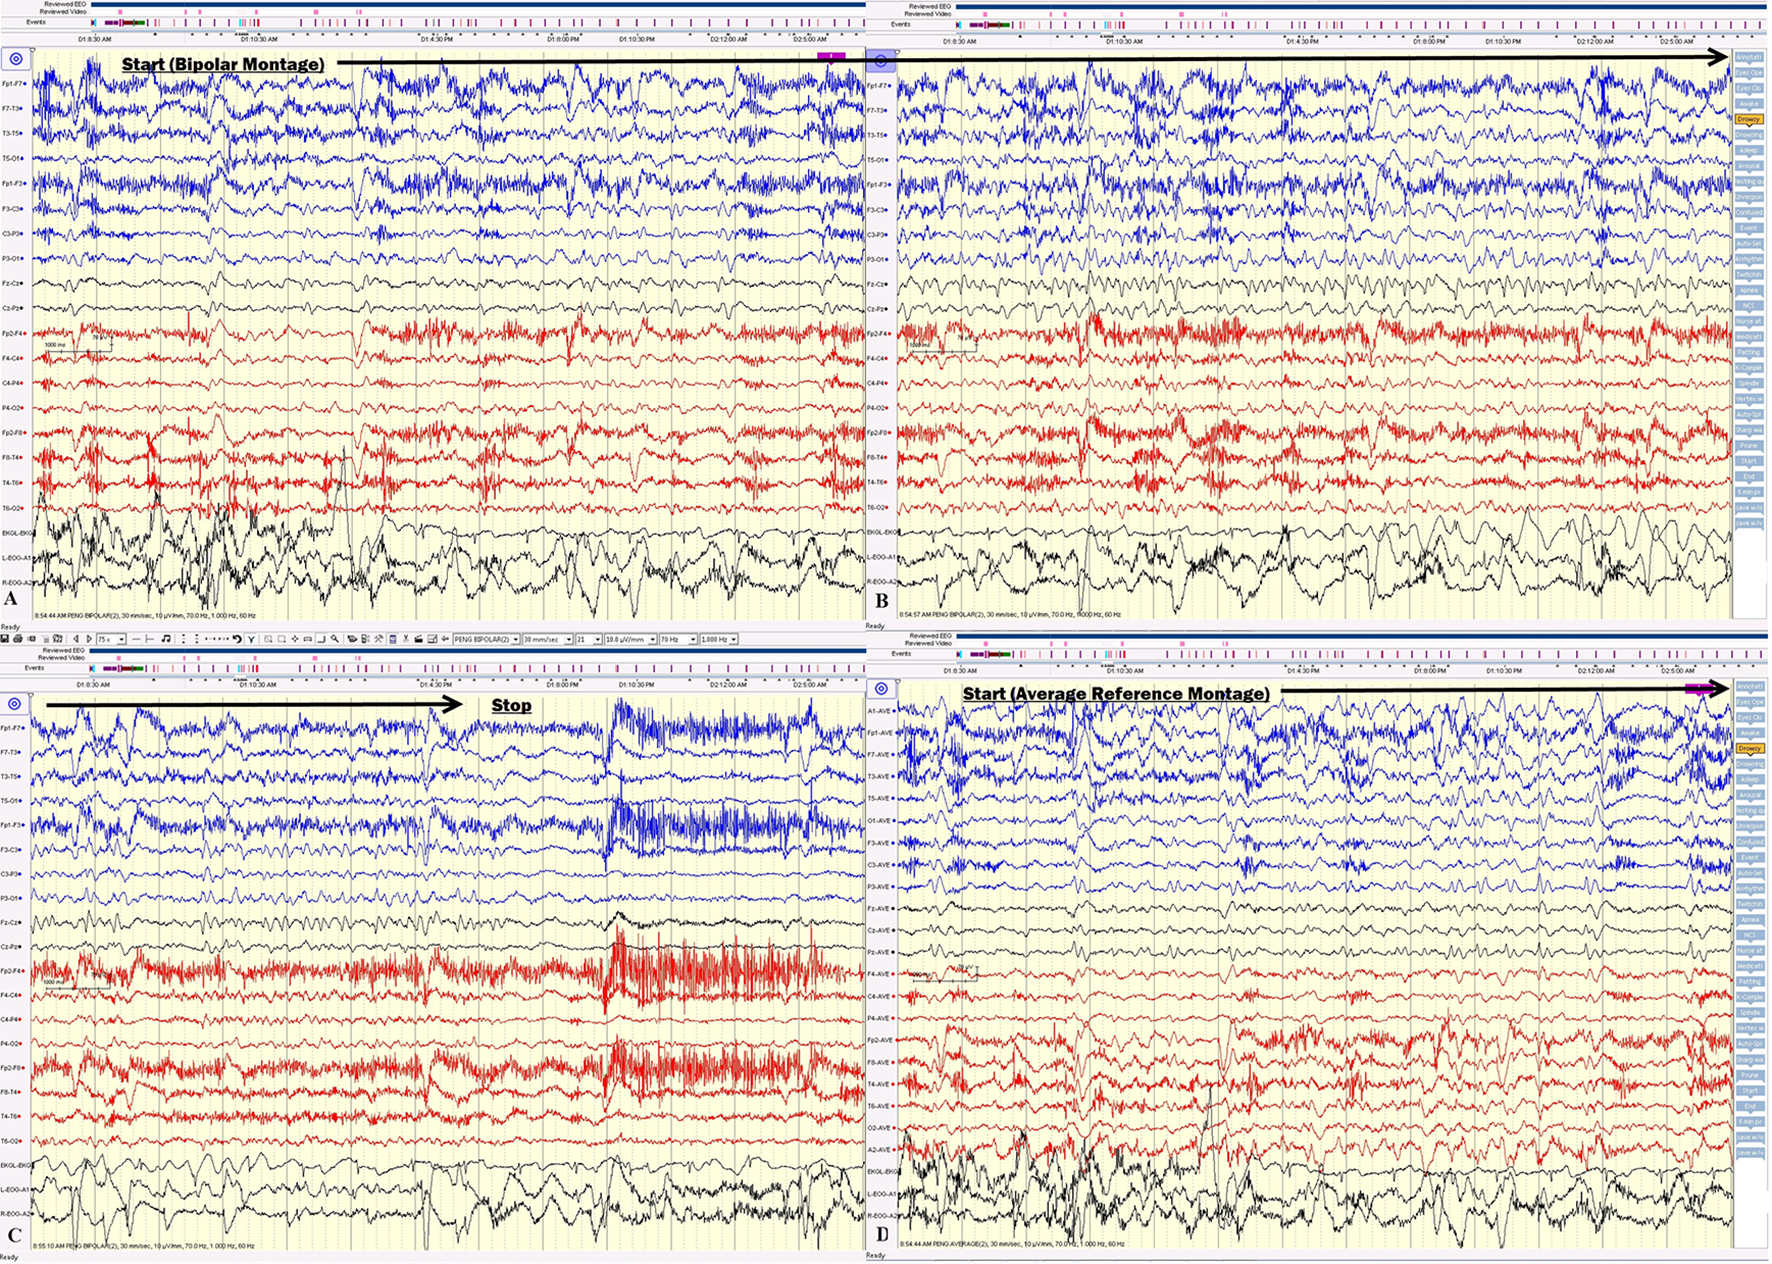
Figure 4. (A, B, C) The electrical seizures started with sudden appearance of repetitive epileptiform sharp waves over the left hemisphere displayed on a bipolar montage, which evolved in amplitude and frequency over the left hemisphere. (D) The onset of the same seizure displayed on an average reference montage.
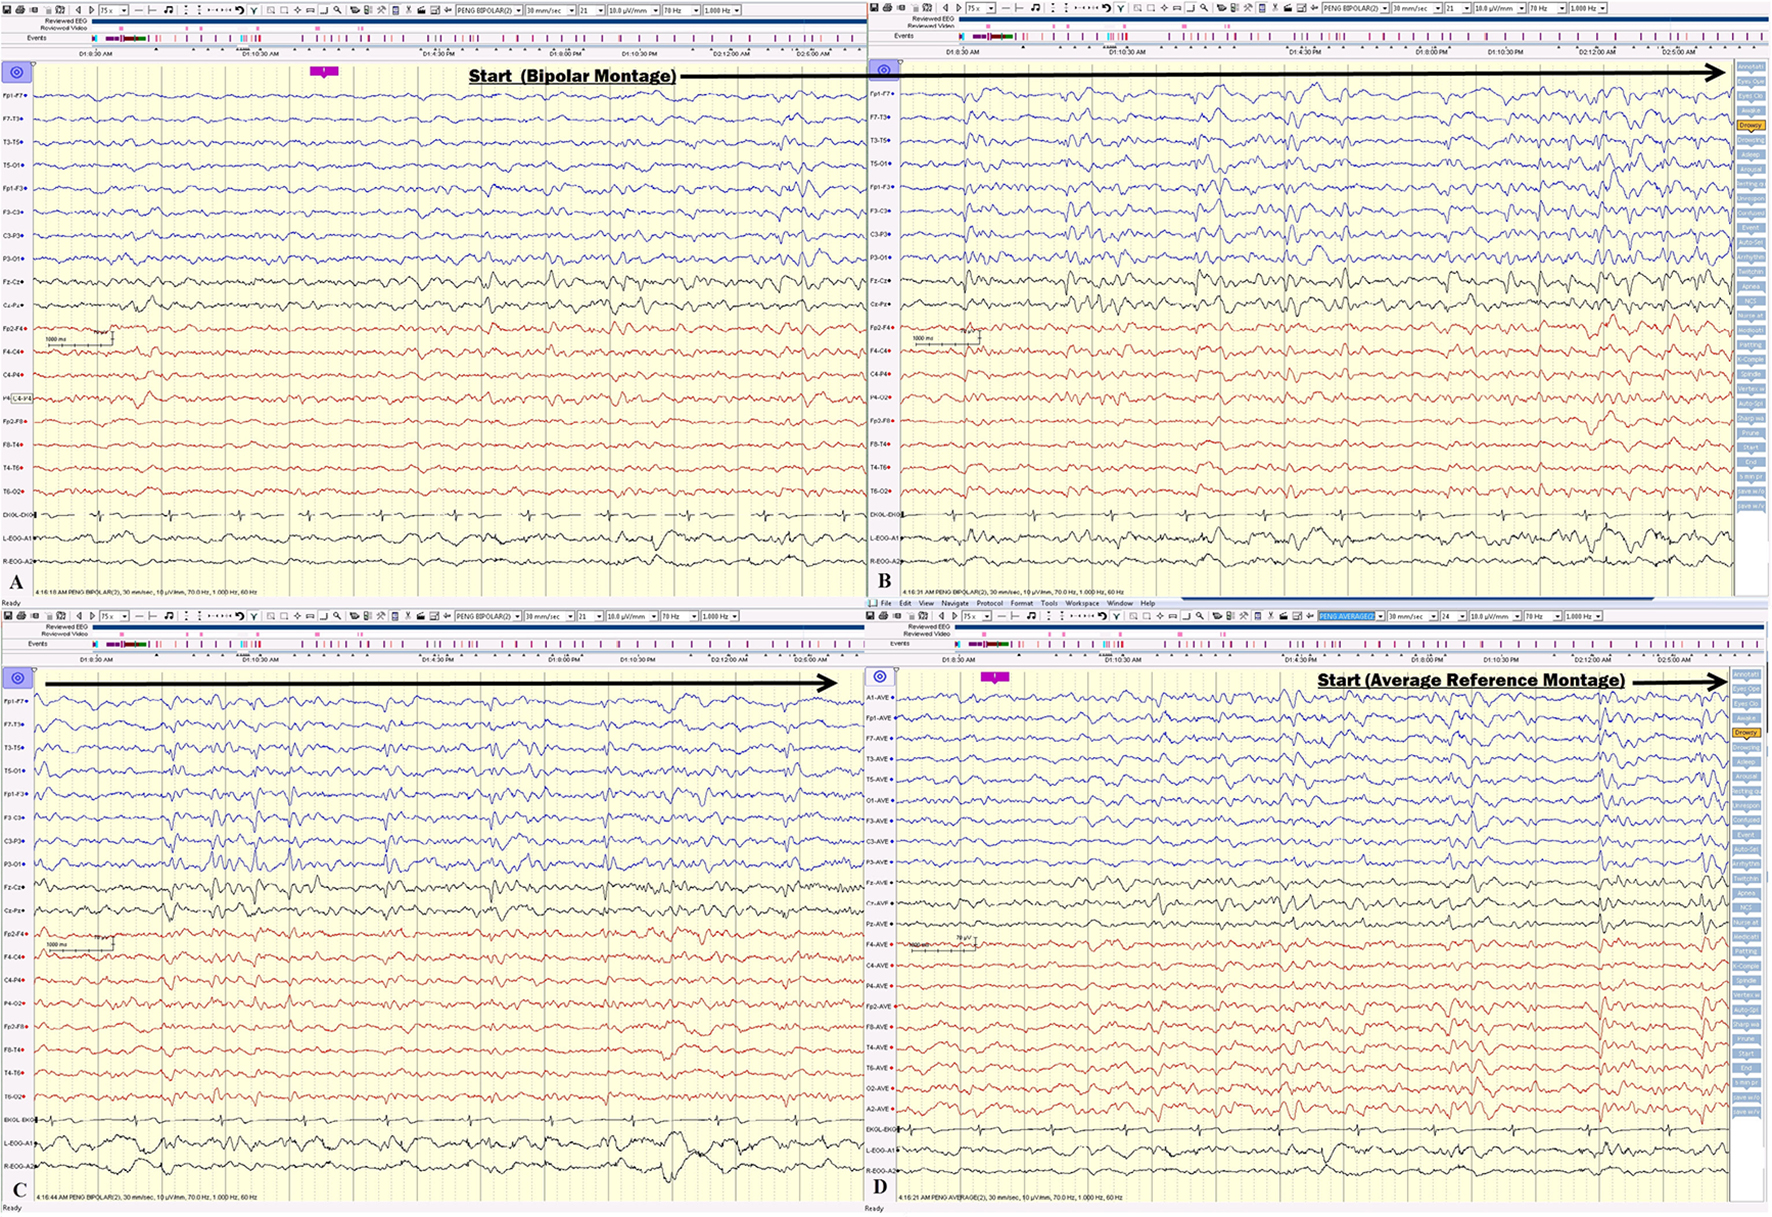
Figure 5. (A, B, C) Electrical seizure in the sleep. (D) The onset of the same seizure displayed on an average reference montage.
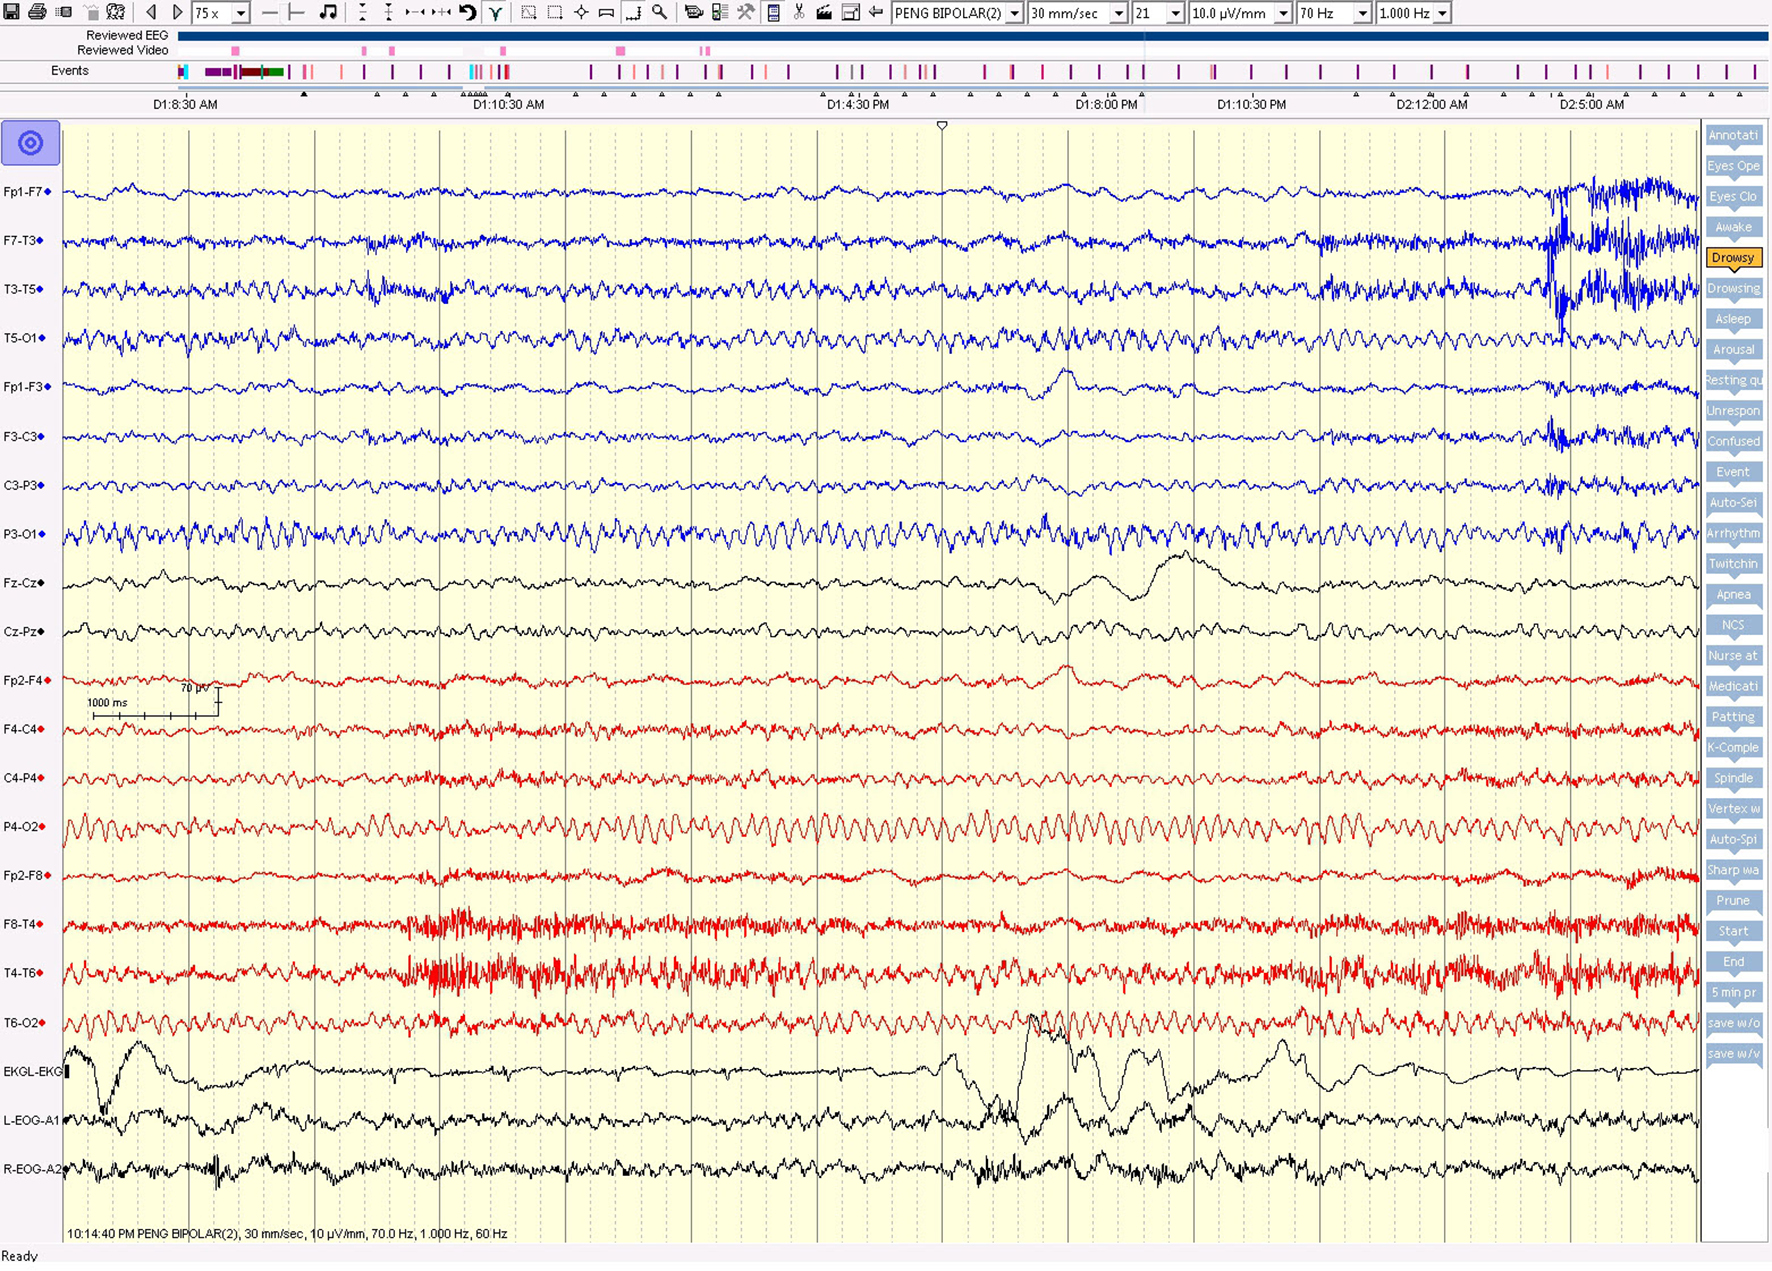
Figure 6. The awake EEG background was well preserved between seizures.
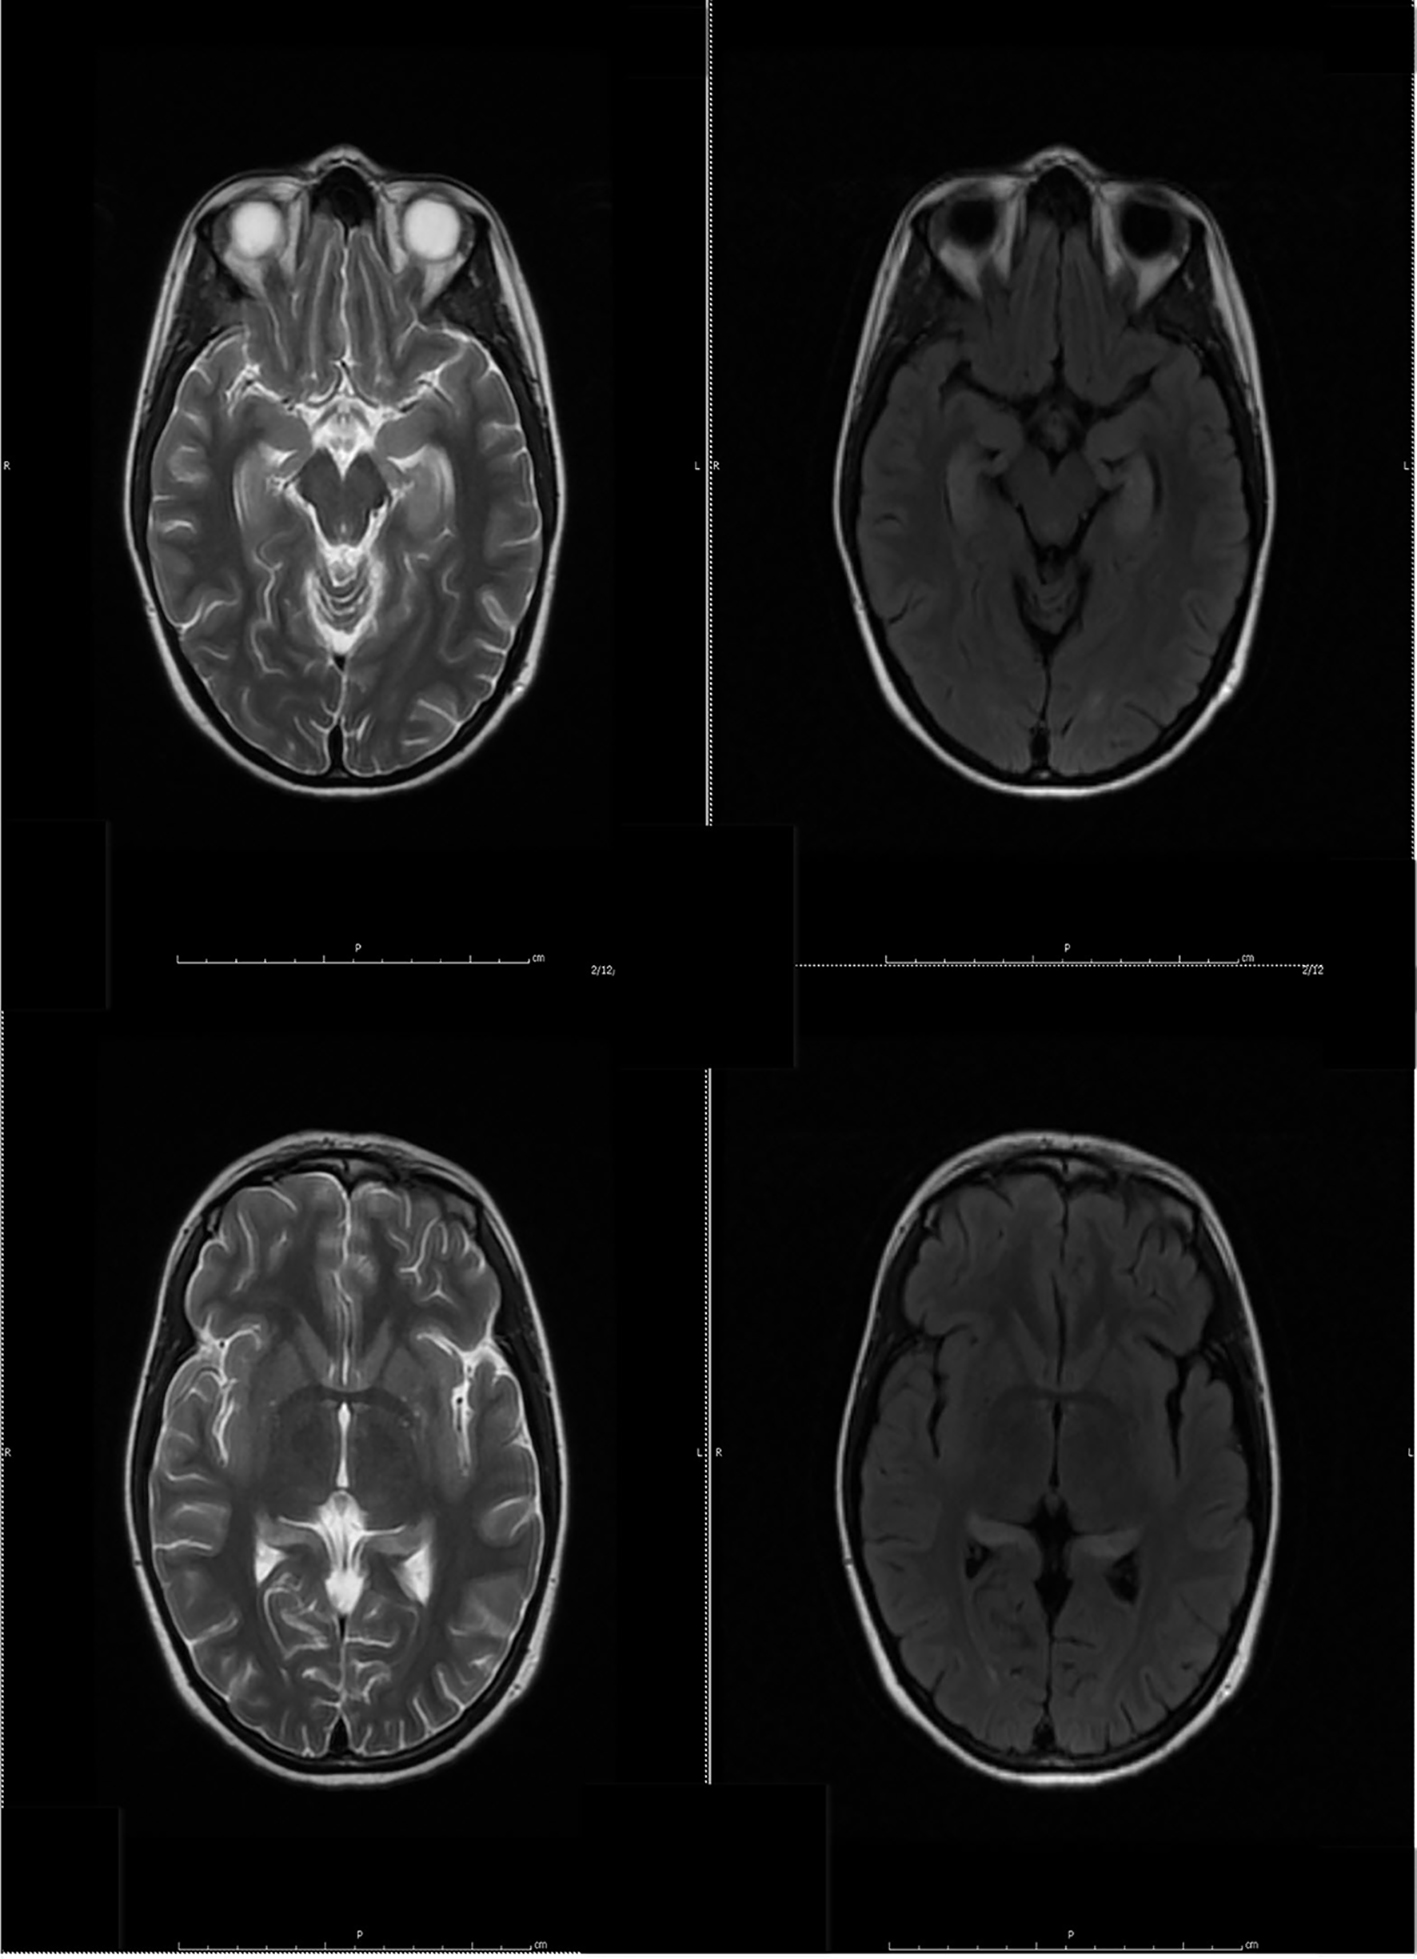
Figure 7. Follow-up MR examination showed significant interval decrease in the extent of T2 signal. MRI in Figure 3 and Figure 7 was 3 weeks apart.