Journal of Clinical Medicine Research, ISSN 1918-3003 print, 1918-3011 online, Open Access
Article copyright, the authors; Journal compilation copyright, J Clin Med Res and Elmer Press Inc
Journal website http://www.jocmr.org

Original Article

Volume 8, Number 10, October 2016, pages 710-714


Secular Trends in the Clinical Characteristics of Type 2 Diabetic Patients With Severe Hypoglycemia Between 2008 and 2013

Figure

Figure 1.
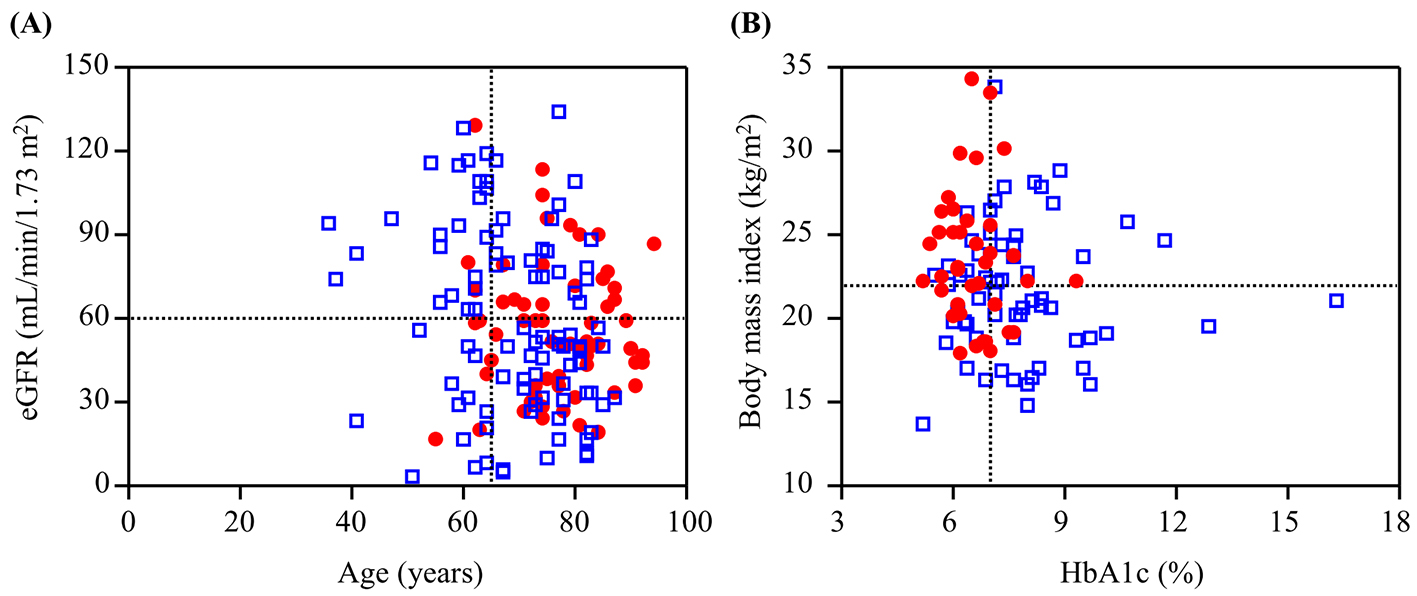
Figure 1. Scatter plots of (A) eGFR and patients’ age and (B) body mass index and HbA1c value categorized by the antidiabetic agents during the entire study period. Open blue squares and closed red circles indicate the patients with severe hypoglycemia induced by insulin and sulfonylureas, respectively.

Tables

Table 1. Trends in the Clinical Characteristics and Prescriptions of Type 2 Diabetic Patients With Severe Hypoglycemia
 
2008 - 2009 (n = 49)2010 - 2011 (n = 79)2012 - 2013 (n = 65)P
DPP-4: dipeptidyl peptidase-4; GLP-1: glucagon-like peptide-1. The P value was determined among the groups divided by the period of visit.
Percentage of subjects transported by ambulance (%)0.670.850.600.23
Male subject (%)6758580.53
Age (years)73 ± 1171 ± 1272 ± 100.55
Duration of diabetes (years)17 ± 1418 ± 1318 ± 100.85
Body mass index (kg/m2)22.0 ± 3.522.6 ± 3.922.9 ± 4.50.66
Blood glucose at arrival (mg/dL)33 ± 1636 ± 1638 ± 150.45
HbA1c (%)7.3 ± 1.96.9 ± 1.27.3 ± 1.60.35
eGFR (mL/min/1.73 m2)60.3 ± 24.657.0 ± 31.859.8 ± 32.00.81
eGFR < 60 mL/min/1.73 m2 (%)5559570.90
Liver dysfunction (%)5480.72
Required hospitalization (%)3943420.89
Medication for diabetes (%)
  Insulin554974< 0.01
  Sulfonylureas454820< 0.01
  Biguanides622200.04
  Thiazolidinediones121160.44
  α-glucosidase inhibitors1827110.05
  Glinides2080.01
  DPP-4 inhibitors01422< 0.01
  GLP-1 receptor agonists000-
Number of antidiabetic agents1.8 ± 0.72.1 ± 0.72.2 ± 0.80.04
Number of non-diabetic agents3.2 ± 2.74.2 ± 3.14.3 ± 3.20.11
Number of total drugs5.0 ± 2.86.3 ± 3.26.5 ± 3.00.02


Table 2. Trends in the Triggers of Severe Hypoglycemia
 
2008 - 2009 (n = 49)2010 - 2011 (n = 79)2012 - 2013 (n = 65)P
The P value was determined among the groups divided by the period of visit.
Decreased food intake (%)3937340.86
Errors of drug use (%)1828370.04
Alcohol consumption (%)8150.15
Unknown (%)3329220.34
Others (%)2530.63


Table 3. Trends in the Clinical Characteristics and Prescriptions of Type 2 Diabetic Patients With Severe Hypoglycemia Caused by Insulin and Sulfonylureas
 
InsulinSulfonylureas
2008 - 2009 (n = 26)2010 - 2011 (n = 39)2012 - 2013 (n = 48)P2008 - 2009 (n = 21)2010 - 2011 (n = 38)2012 - 2013 (n = 13)P
The P value was determined among the groups divided by the period of visit. *P < 0.05 and **P < 0.01 vs. the corresponding value in patients receiving insulin therapy.
Male subject (%)7767650.52574731*0.32
Age (years)68 ± 1167 ± 1270 ± 90.5680 ± 6**75 ± 9**77 ± 10*0.09
Duration of diabetes (years)15 ± 1521 ± 1519 ± 100.1319 ± 1315 ± 1017 ± 110.58
Body mass index (kg/m2)20.5 ± 2.522.2 ± 4.022.1 ± 4.30.2524.2 ± 4.1**23.5 ± 3.624.0 ± 4.40.87
Blood glucose at arrival (mg/dL)35 ± 1844 ± 1940 ± 160.2031 ± 1329 ± 7**32 ± 12**0.68
HbA1c (%)8.1 ± 2.27.4 ± 1.47.7 ± 1.70.226.3 ± 0.8**6.6 ± 0.7*6.4 ± 0.80.34
eGFR (mL/min/1.73 m2)65.7 ± 28.857.9 ± 35.159.9 ± 34.40.6254.2 ± 18.553.6 ± 27.463.3 ± 21.00.33
eGFR < 60 mL/min/1.73 m2 (%)3658580.2078**64500.28
Liver dysfunction (%)0680.256380.76
Required hospitalization (%)2731290.955258*92**0.02
Number of antidiabetic agents1.9 ± 0.62.2 ± 0.62.3 ± 0.70.031.6 ± 0.82.0 ± 0.82.1 ± 0.90.17
Number of non-diabetic agents2.3 ± 2.44.1 ± 3.04.3 ± 3.30.024.1 ± 2.7*4.6 ± 3.34.0 ± 2.70.92
Number of total drugs4.2 ± 2.66.2 ± 2.96.6 ± 3.2< 0.015.8 ± 2.8*6.6 ± 3.36.1 ± 2.50.78