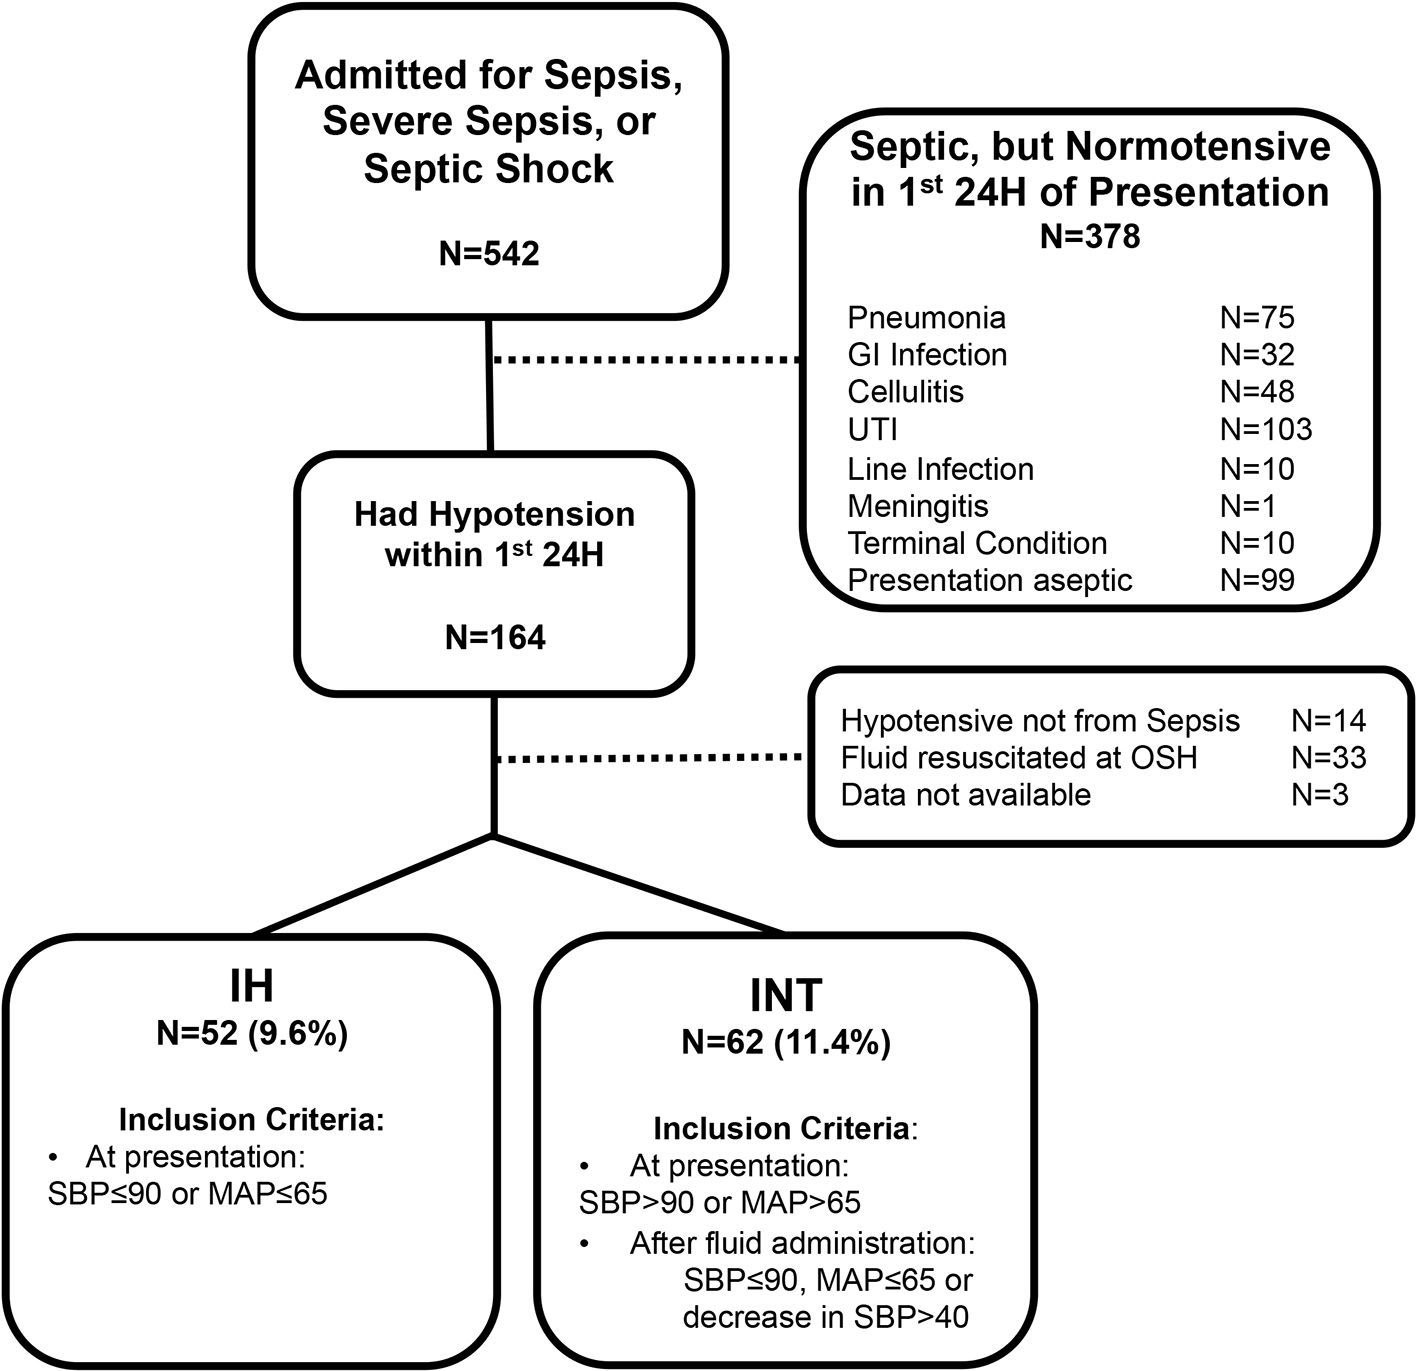
Figure 1. Retrospective cohort study design. H: hours; IH: initially hypotensive; INT: initially normotensive; OSH: outside hospital; SBP: systolic blood pressure; MAP: mean arterial pressure.
| Journal of Clinical Medicine Research, ISSN 1918-3003 print, 1918-3011 online, Open Access |
| Article copyright, the authors; Journal compilation copyright, J Clin Med Res and Elmer Press Inc |
| Journal website http://www.jocmr.org |
Original Article
Volume 8, Number 8, August 2016, pages 575-581
Predictors of Acute Hemodynamic Decompensation in Early Sepsis: An Observational Study
Figure
Tables
| IH | INT | P‡ | |
|---|---|---|---|
| BMI: body mass index. *Value expressed as mean (SD). †Value expressed as N (%). ‡Significance assessed by Student’s t-test or Pearson’s Chi-square test as applicable. | |||
| Number of subjects | 52 | 62 | |
| Age, years* | 79 (12) | 75 (11) | 0.124 |
| Gender, male† | 52 (100) | 61 (98) | 0.362 |
| Race† | 0.013 | ||
| Caucasian | 27 (52) | 46 (74) | |
| African American and other | 25 (48) | 16 (26) | |
| Outpatient setting† | 0.619 | ||
| Home | 36 (69) | 44 (71) | |
| Nursing Home | 16 (31) | 17 (27) | |
| Undomiciled | 0 (0) | 1 (2) | |
| Days of illness prior to presentation* | 3 (3) | 3 (3) | 0.207 |
| BMI, kg/m2* | 24 (5) | 27 (6) | 0.010 |
| IH | INT | P† | |
|---|---|---|---|
| DM: diabetes mellitus; ESRD: end-stage renal disease; ACE/ARB: angiotensin converting enzyme inhibitor/angiotensin receptor blocker. Heart disease: coronary artery disease, congestive heart failure, and arrhythmia; neurologic disease: dementia, Parkinson’s disease, seizure, cerebral vascular aneurysm, and multiple sclerosis. *Value expressed as N (%). †Significance assessed by Pearson’s Chi-square test. | |||
| Comorbid conditions* | |||
| Cancer | 18 (35) | 21 (34) | 0.933 |
| DM | 16 (31) | 24 (39) | 0.376 |
| ESRD | 11 (21) | 6 (10) | 0.087 |
| Heart disease | 22 (42) | 31 (50) | 0.412 |
| Neurologic disease | 11 (21) | 15 (24) | 0.700 |
| Home medications* | |||
| ACE/ARB | 22 (42) | 27 (44) | 0.834 |
| α-blocker | 12 (23) | 25 (40) | 0.050 |
| Aspirin | 20 (39) | 28 (45) | 0.525 |
| β-blocker | 26 (50) | 25 (40) | 0.301 |
| Ca2+ channel blocker | 12 (23) | 13 (21) | 0.786 |
| Chronic Steroid | 3 (6) | 11 (18) | 0.045 |
| Diuretics | 20 (39) | 20 (32) | 0.489 |
| Statin | 18 (35) | 28 (45) | 0.253 |
| IH | INT | P* | |
|---|---|---|---|
| HR: heart rate; RR: respiration rate; BP: blood pressure; MAP: mean arterial pressure; CBC: complete blood count; WBC: white blood count; Hct: hematocrit; AST: aspartate transaminase; ALT: alanine transaminase. All available values reported in mean (SD). *Calculated by Student’s t-test. | |||
| HR, per minute | 81 (22) | 97 (25) | 0.001 |
| RR, per minute | 20 (4) | 20 (5) | 0.275 |
| BP, mm Hg | |||
| Systolic | 81 (10) | 120 (16) | < 0.001 |
| Diastolic | 46 (9) | 71 (14) | < 0.001 |
| MAP | 57 (7) | 88 (12) | < 0.001 |
| Temperature, °F | 98.8 (2) | 100.4 (2) | < 0.001 |
| APACHE II lab values within 24 h | |||
| CBC | |||
| WBC, × 103/µL | 17 (10) | 14 (8) | 0.054 |
| Hct, % | 33 (6) | 34 (7) | 0.470 |
| Platelet, × 103/µL | 230 (140) | 211 (92) | 0.383 |
| Chemistries | |||
| Sodium, mEq/L | 141 (7) | 139 (5) | 0.057 |
| Potassium, mEq/L | 5.7 (6) | 4.7 (0.9) | 178 |
| CO2, mmol/L | 22 (7) | 25 (6) | 0.037 |
| Creatinine, mg/dL | 3.9 (3) | 2.2 (1) | < 0.001 |
| Liver function test | |||
| AST, U/L | 117 (320) | 93 (190) | 0.616 |
| ALT, U/L | 107 (321) | 63 (127) | 0.327 |
| Bilirubin, mg/dL | 1.6 (4.2) | 1.0 (0.8) | 0.215 |
| Lactate, mmol/L | 3 (3) | 3 (2) | 0.476 |
| IH | INT | P‡ | |
|---|---|---|---|
| GI: gastrointestinal; H: hours; min: minutes. *Value expressed as mean (SD). †Value expressed as N (%). ‡Significance assessed by Student’s t-test or Chi-square test as applicable. | |||
| Source of infection† | |||
| Cellulitis | 3 (6) | 9 (15) | 0.130 |
| GI | 12 (23) | 9 (15) | 0.240 |
| Line infection | 3 (6) | 1 (2) | 0.230 |
| Pneumonia | 5 (10) | 15 (24) | 0.042 |
| Urinary tract | 25 (48) | 22 (36) | 0.174 |
| Unclear source | 6 (12) | 7 (11) | 0.967 |
| Positive culture† | |||
| Blood | 12 (23) | 16 (26) | 0.736 |
| Urine | 19 (37) | 17 (27) | 0.297 |
| Others | 14 (27) | 4 (7) | 0.003 |
| Gram stain† | |||
| Gram positive | 18 (35) | 9 (15) | 0.012 |
| Gram negative | 23 (44) | 21 (34) | 0.258 |
| Time to hypotension, H:min* | - | 3:18 | - |
| Time to antibiotics, H:min* | 2:21 (1:48) | 2:52 (2:47) | 0.268 |
| Amount of fluid in 24 h, L* | 3.9 (2) | 4.3 (2) | 0.217 |
| Required vasopressor† | 12 (23) | 13 (21) | 0.786 |
| Mortality† | |||
| 28 days | 14 (27) | 15 (24) | 0.739 |
| 1 year | 28 (54) | 31 (50) | 0.682 |
| IH | INT | P‡ | |
|---|---|---|---|
| *Value expressed as mean (SD). †Value expressed as N (%). ‡Significance assessed by Student’s t-test or Chi-square test as applicable. | |||
| Charlson comorbidity index* | 7 (2) | 7 (2) | 0.795 |
| APACHE II* | 20 (5) | 18 (5) | 0.070 |
| Organ dysfunction† | |||
| Respiratory | 7 (14) | 8 (13) | 0.930 |
| Kidney | 35 (67) | 38 (61) | 0.505 |
| Liver | 11 (22) | 19 (31) | 0.277 |
| Length of stay, days* | |||
| ICU | 15 (13) | 17 (26) | 0.149 |
| Hospital | 8 (6) | 8 (6) | 0.960 |
| Covariates | Crude* | P | Adjusted* | P |
|---|---|---|---|---|
| AUC: area under the curve. *Values expressed as odds ratio (95% CI). Hosmer-Lemeshow of adjusted final model: Chi-square 9.67, df = 8, P = 0.289. | ||||
| α-Blocker | 2.25 (0.991 - 5.118) | 0.053 | 3.02 (1.09 - 8.36) | 0.033 |
| Caucasian | 2.66 (1.21 - 5.85) | 0.015 | 3.23 (1.23 - 8.50) | 0.018 |
| Temperature | 1.37 (1.15 - 1.64) | 0.001 | 1.36 (1.11 - 1.67) | 0.003 |
| Age | 0.98 (0.94 - 1.01) | 0.124 | 0.97 (0.93 - 1.01) | 0.188 |
| BMI | 1.09 (1.02 - 1.17) | 0.014 | 1.08 (0.99 - 1.17) | 0.071 |
| Pneumonia | 2.74 (0.92 - 8.22) | 0.072 | 2.70 (0.80 - 9.15) | 0.110 |
| AUC | 0.815 (0.736 - 0.894) | |||