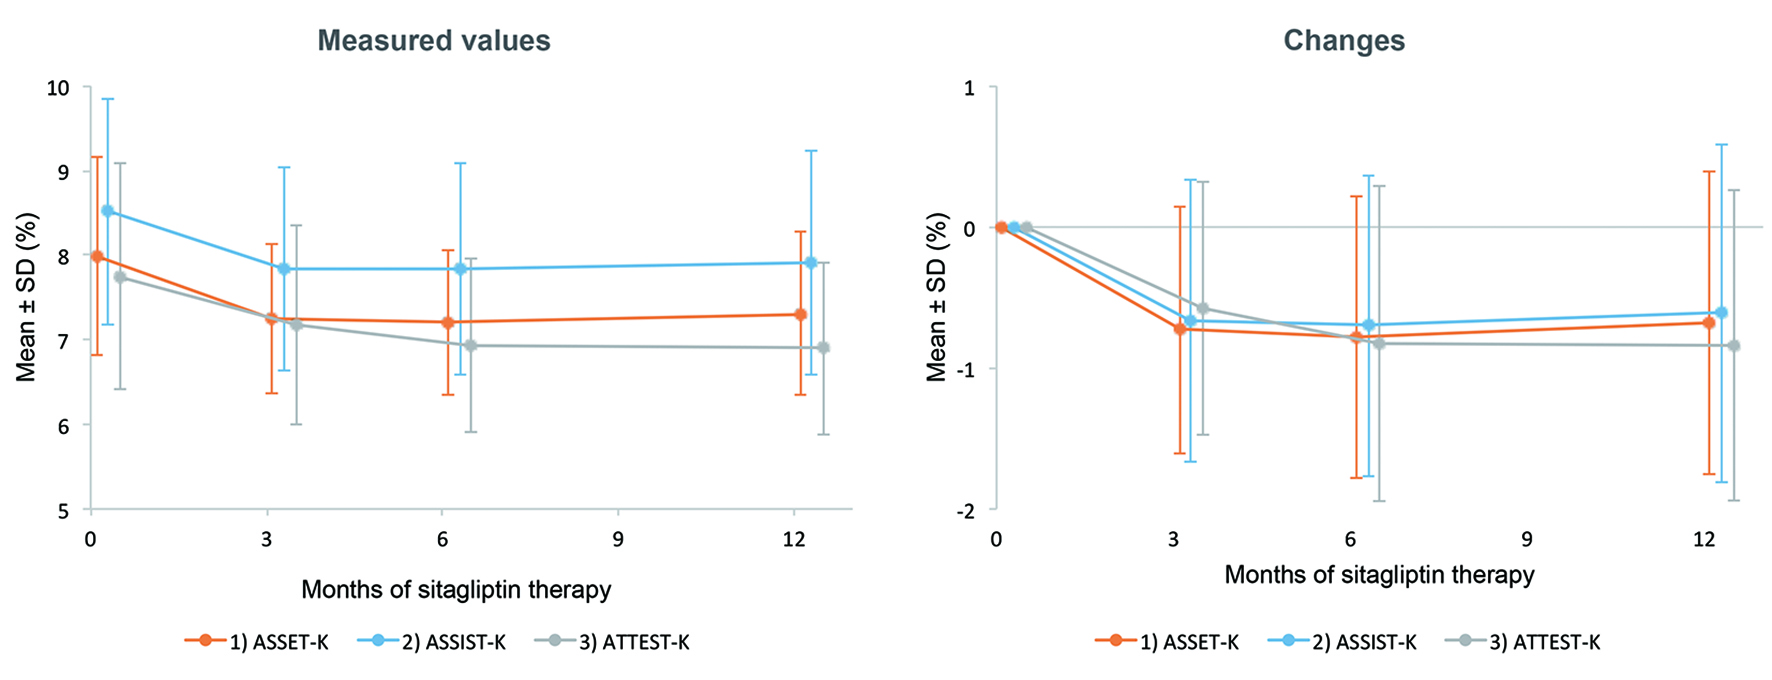
Figure 1. Changes in HbA1c. There was a significant decrease in HbA1c after 12 months of sitagliptin therapy in all three studies.
| Journal of Clinical Medicine Research, ISSN 1918-3003 print, 1918-3011 online, Open Access |
| Article copyright, the authors; Journal compilation copyright, J Clin Med Res and Elmer Press Inc |
| Journal website http://www.jocmr.org |
Original Article
Volume 8, Number 6, June 2016, pages 461-471
Factor Analysis of Changes in Hemoglobin A1c After 12 Months of Sitagliptin Therapy in Patients With Type 2 Diabetes
Figures
Tables
| 1. ASSET-K specialist insulin, no | 2. ASSIST-K specialist insulin, yes | 3. ATTEST-K non-specialist | Comparison between groups: P value | ||||
|---|---|---|---|---|---|---|---|
| 1 vs. 2 | 1 vs. 3 | 2 vs. 3 | |||||
| *P < 0.05. SD: standard deviation; BMI: body mass index; HbA1c: hemoglobin A1c; NGSP: National Glycohemoglobin Standardization Program; eGFR: estimated glomerular filtration rate. | |||||||
| Statistical analysis set, n | 1,074 (100.0%) | 854 (100.0%) | 411 (100.0%) | ||||
| Sex | Male | 605 (56.3%) | 455 (53.3%) | 224 (54.5%) | Chi-square test | ||
| Female | 469 (43.7%) | 399 (46.7%) | 176 (42.8%) | 0.181 | 0.909 | 0.367 | |
| Age at registration | Mean ± SD | 63.1 ± 11.4 | 64.1 ± 11.9 | 68.0 ± 11.1 | t-test | ||
| N | 1,074 | 854 | 409 | 0.062 | < 0.001* | < 0.001* | |
| Complications of diabetes | |||||||
| Retinopathy | No | 744 (69.3%) | 460 (53.9%) | 289 (70.3%) | Chi-square test | ||
| Yes | 256 (23.8%) | 294 (34.4%) | 32 (7.8%) | < 0.001* | < 0.001* | < 0.001* | |
| Neuropathy | No | 686 (63.9%) | 441 (51.6%) | 344 (83.7%) | Chi-square test | ||
| Yes | 299 (27.8%) | 304 (35.6%) | 30 (7.3%) | < 0.001* | < 0.001* | < 0.001* | |
| Nephropathy | No | 701 (65.3%) | 410 (48.0%) | 309 (75.2%) | Chi-square test | ||
| Yes | 331 (30.8%) | 342 (40.0%) | 68 (16.5%) | < 0.001* | < 0.001* | < 0.001* | |
| Arteriosclerotic disease | |||||||
| Cerebrovascular accident | No | 976 (90.9%) | 657 (76.9%) | 361 (87.8%) | Chi-square test | ||
| Yes | 64 (6.0%) | 67 (7.8%) | 41 (10.0%) | 0.015* | 0.008* | 0.606 | |
| Myocardial infarction or angina | No | 973 (90.6%) | 585 (68.5%) | 366 (89.1%) | Chi-square test | ||
| Yes | 71 (6.6%) | 144 (16.9%) | 35 (8.5%) | < 0.001* | 0.208 | < 0.001* | |
| Arteriosclerosis obliterans | No | 1,020 (95.0%) | 627 (73.4%) | 388 (94.4%) | Chi-square test | ||
| Yes | 23 (2.1%) | 83 (9.7%) | 10 (2.4%) | < 0.001* | 0.727 | < 0.001* | |
| Other complications | |||||||
| Hypertension | No | 548 (51.0%) | 287 (33.6%) | 110 (26.8%) | Chi-square test | ||
| Yes | 526 (49.0%) | 492 (57.6%) | 297 (72.3%) | < 0.001* | < 0.001* | < 0.001* | |
| Dyslipidemia | No | 549 (51.1%) | 240 (28.1%) | 112 (27.3%) | Chi-square test | ||
| Yes | 525 (48.9%) | 543 (63.6%) | 291 (70.8%) | < 0.001* | < 0.001* | 0.307 | |
| Fatty liver | No | 1,064 (99.1%) | 383 (44.8%) | 214 (52.1%) | Chi-square test | ||
| Yes | 10 (0.9%) | 280 (32.8%) | 88 (21.4%) | < 0.001* | < 0.001* | < 0.001* | |
| Smoking history | No | 617 (57.4%) | 390 (45.7%) | 268 (65.2%) | Chi-square test | ||
| Yes | 324 (30.2%) | 216 (25.3%) | 92 (22.4%) | 0.625 | 0.002* | 0.001* | |
| Drinking history | No | 562 (52.3%) | 383 (44.8%) | 221 (53.8%) | Chi-square test | ||
| Yes | 386 (35.9%) | 199 (23.3%) | 137 (33.3%) | 0.011* | 0.420 | 0.205 | |
| Duration of diabetes, years | Mean ± SD | 12.0 ± 7.9 | 17.1 ± 9.1 | 9.2 ± 7.4 | t-test | ||
| N | 987 | 722 | 242 | < 0.001* | < 0.001* | < 0.001* | |
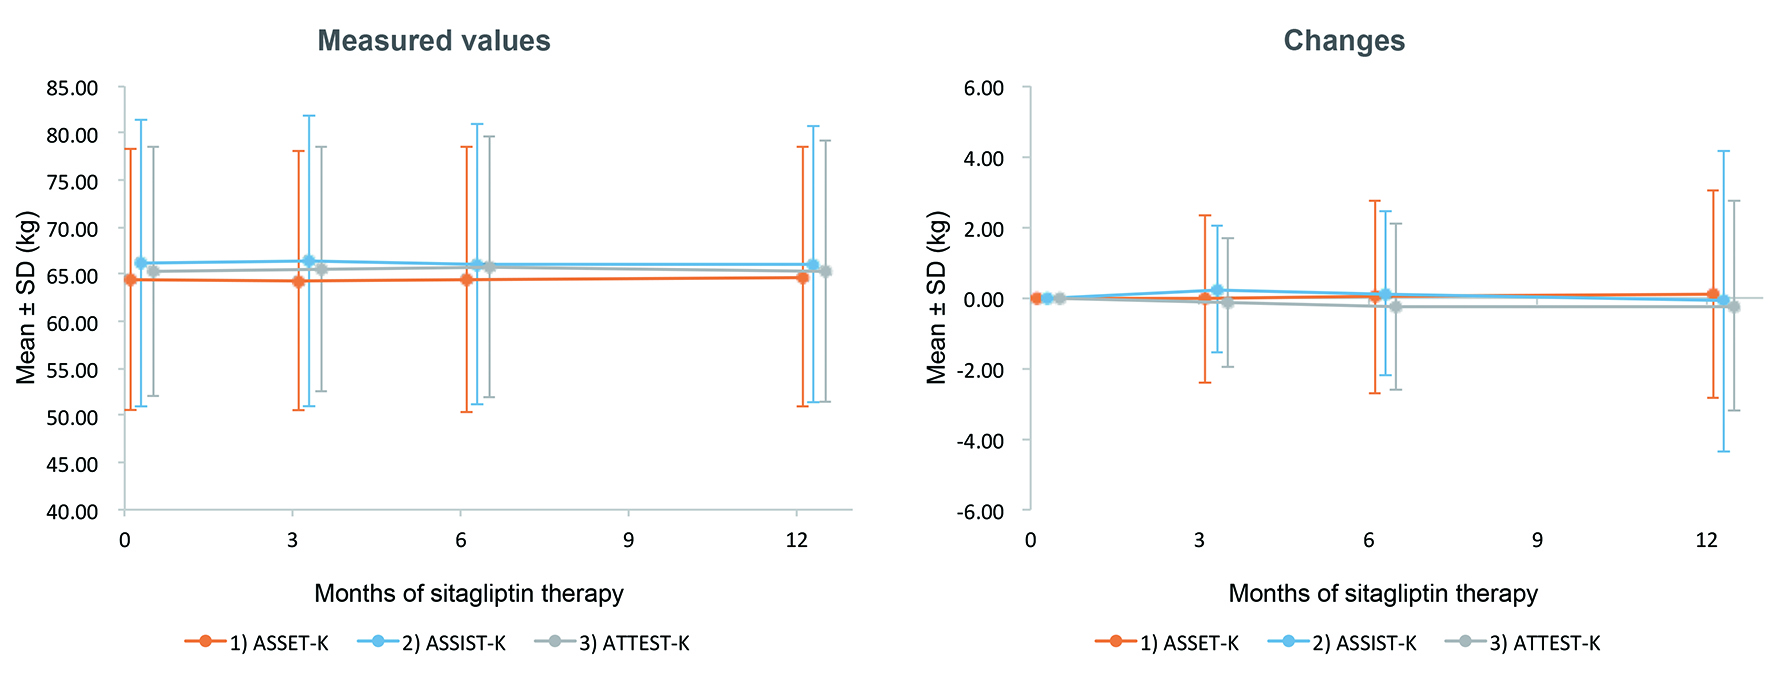
| Body weight at the start of treatment | Mean ± SD | 64.46 ± 13.86 | 66.17 ± 15.20 | 65.23 ± 13.25 | t-test | ||
| N | 1,062 | 853 | 387 | 0.011* | 0.343 | 0.271 | |
| BMI at the start of treatment | Mean ± SD | 24.66 ± 4.33 | 25.39 ± 4.52 | 25.31 ± 3.98 | t-test | ||
| N | 1,057 | 824 | 375 | < 0.001* | 0.012* | 0.731 | |
| HbA1c at the start of treatment (NGSP, %) | Mean ± SD | 7.99 ± 1.17 | 8.52 ± 1.34 | 7.75 ± 1.34 | t-test | ||
| N | 1,074 | 854 | 411 | < 0.001* | 0.002* | < 0.001* | |
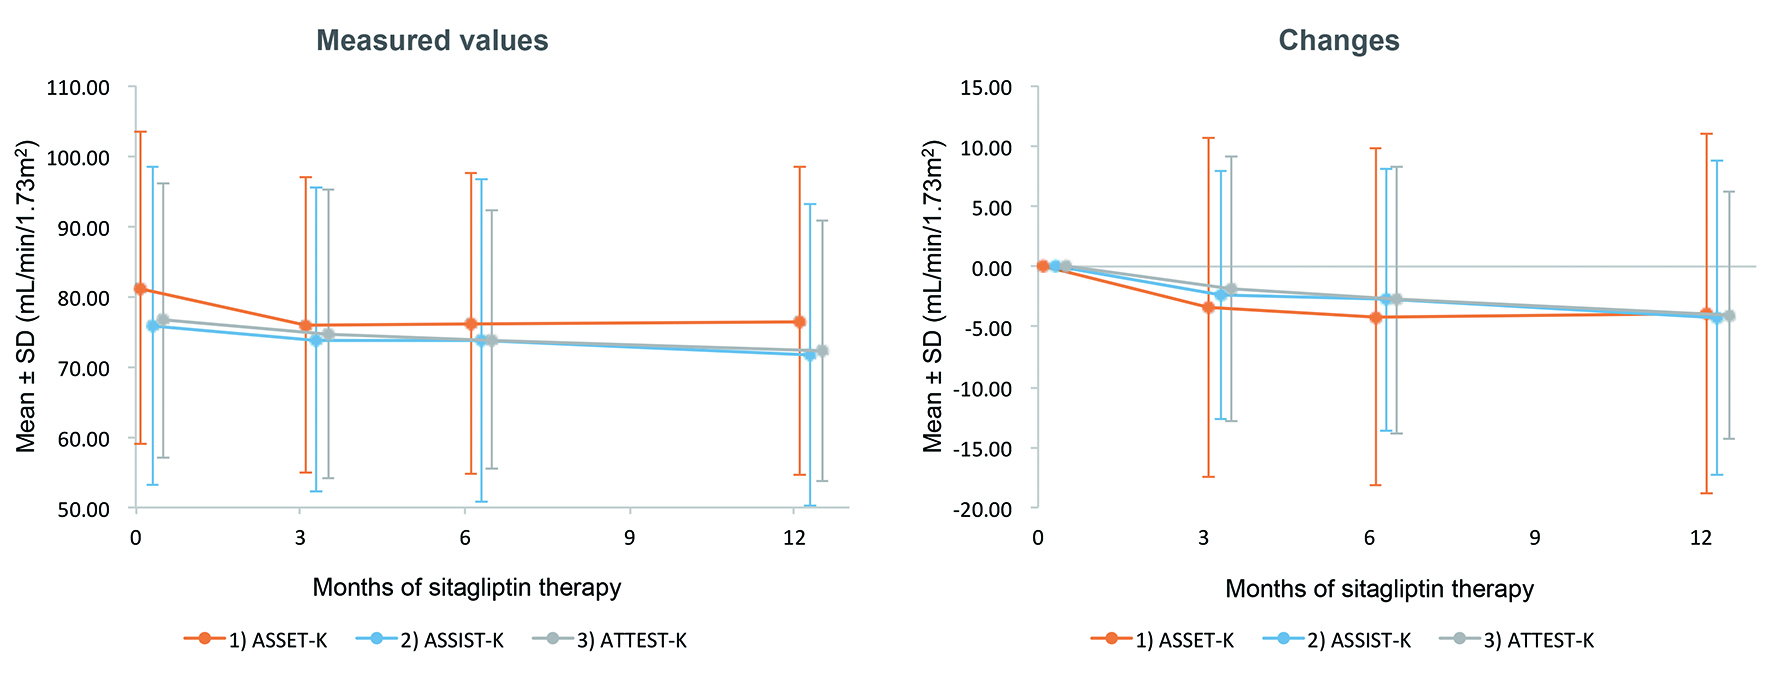
| eGFR at the start of treatment (mL/min/1.73 m2) | Mean ± SD | 81.187 ± 22.180 | 75.885 ± 22.659 | 76.638 ± 19.555 | t-test | ||
| N | 792 | 625 | 348 | < 0.001* | < 0.001* | 0.587 | |
| Antidiabetic drugs | 1. ASSET-K specialist insulin, no | 2. ASSIST-K specialist insulin, yes | 3. ATTEST-K non-specialist | Comparison between groups: P value | ||||
|---|---|---|---|---|---|---|---|---|
| 1 vs. 2 | 1 vs. 3 | 2 vs. 3 | ||||||
| *P < 0.05. SD: standard deviation. | ||||||||
| Statistical analysis set, n | 1,074 (100.0%) | 854 (100.0%) | 411 (100.0%) | |||||
| Before administration of sitagliptin | Chi-square test | |||||||
| Insulin | Yes | 0 (0.0%) | 854 (100.0%) | 9 (2.2%) | < 0.001* | < 0.001* | < 0.001* | |
| Sulfonylureas | Yes | 701 (65.3%) | 191 (22.4%) | 146 (35.5%) | < 0.001* | < 0.001* | < 0.001* | |
| Biguanides | Yes | 548 (51.0%) | 354 (41.5%) | 89 (21.7%) | < 0.001* | < 0.001* | < 0.001* | |
| Thiazolidinediones | Yes | 289 (26.9%) | 92 (10.8%) | 79 (19.2%) | < 0.001* | 0.002* | < 0.001* | |
| α-Glucosidase inhibitors | Yes | 293 (27.3%) | 227 (26.6%) | 77 (18.7%) | 0.731 | < 0.001* | 0.002* | |
| Glinides | Yes | 85 (7.9%) | 15 (1.8%) | 23 (5.6%) | < 0.001* | 0.124 | < 0.001* | |
| Number of drugs | 0 | 134 (12.5%) | 0 (0.0%) | 143 (34.8%) | Wilcoxon test | |||
| 1 | 282 (26.3%) | 300 (35.1%) | 149 (36.3%) | < 0.001* | < 0.001* | < 0.001* | ||
| 2 | 390 (36.3%) | 298 (34.9%) | 84 (20.4%) | |||||
| 3 or more | 268 (25.0%) | 256 (30.0%) | 35 (8.5%) | |||||
| Mean ± SD | 1.8 ± 1.1 | 2.0 ± 1.0 | 1.0 ± 1.0 | |||||
| At the start of sitagliptin therapy | Sitagliptin dose (mg) | Mean ± SD | 49.52 ± 6.60 | 46.42 ± 11.19 | 49.20 ± 14.34 | Wilcoxon test | ||
| N | 1,074 | 853 | 404 | < 0.001* | < 0.001* | 0.004* | ||
| Chi-square test | ||||||||
| Insulin | Yes | 0 (0.0%) | 853 (99.9%) | 10 (2.4%) | < 0.001* | < 0.001* | < 0.001* | |
| Sulfonylureas | Yes | 688 (64.1%) | 184 (21.5%) | 153 (37.2%) | < 0.001* | < 0.001* | < 0.001* | |
| Biguanides | Yes | 521 (48.5%) | 338 (39.6%) | 93 (22.6%) | < 0.001* | < 0.001* | < 0.001* | |
| Thiazolidinediones | Yes | 255 (23.7%) | 57 (6.7%) | 53 (12.9%) | < 0.001* | < 0.001* | < 0.001* | |
| α-Glucosidase inhibitors | Yes | 102 (9.5%) | 174 (20.4%) | 41 (10.0%) | < 0.001* | 0.78 | < 0.001* | |
| Glinides | Yes | 24 (2.2%) | 1 (0.1%) | 0 (0.0%) | < 0.001* | 0.002* | 0.488 | |
| Number of concomitant medications | 0 | 194 (18.1%) | 1 (0.1%) | 164 (39.9%) | Wilcoxon test | |||
| 1 | 356 (33.1%) | 350 (41.0%) | 166 (40.4%) | < 0.001* | < 0.001* | < 0.001* | ||
| 2 | 360 (33.5%) | 289 (33.8%) | 60 (14.6%) | |||||
| 3 or more | 164 (15.3%) | 214 (25.1%) | 21 (5.1%) | |||||
| Mean ± SD | 1.5 ± 1.0 | 1.9 ± 0.9 | 0.9 ± 0.9 | |||||
| After 12 months of sitagliptin therapy | Sitagliptin dose (mg) | Mean ± SD | 56.98 ± 18.66 | 52.22 ± 15.85 | 51.91 ± 15.55 | Wilcoxon test | ||
| N | 1,025 | 843 | 399 | < 0.001* | < 0.001* | 0.737 | ||
| Chi-square test | ||||||||
| Insulin | Yes | 0 (0.0%) | 847 (99.2%) | 11 (2.7%) | < 0.001* | < 0.001* | < 0.001* | |
| Sulfonylureas | Yes | 702 (65.4%) | 165 (19.3%) | 166 (40.4%) | < 0.001* | < 0.001* | < 0.001* | |
| Biguanides | Yes | 578 (53.8%) | 285 (33.4%) | 107 (26.0%) | < 0.001* | < 0.001* | 0.008* | |
| Thiazolidinediones | Yes | 238 (22.2%) | 61 (7.1%) | 53 (12.9%) | < 0.001* | < 0.001* | < 0.001* | |
| α-Glucosidase inhibitors | Yes | 99 (9.2%) | 174 (20.4%) | 46 (11.2%) | < 0.001* | 0.251 | < 0.001* | |
| Glinides | Yes | 20 (1.9%) | 0 (0.0%) | 0 (0.0%) | < 0.001* | 0.005* | Not testable | |
| Number of concomitant medications | 0 | 168 (15.6%) | 5 (0.6%) | 153 (37.2%) | Wilcoxon test | |||
| 1 | 355 (33.1%) | 390 (45.7%) | 161 (39.2%) | < 0.001* | < 0.001* | < 0.001* | ||
| 2 | 387 (36.0%) | 262 (30.7%) | 72 (17.5%) | |||||
| 3 or more | 164 (15.3%) | 197 (23.1%) | 25 (6.1%) | |||||
| Mean ± SD | 1.5 ± 1.0 | 1.8 ± 0.9 | 0.9 ± 0.9 | |||||
| Explanatory variable | 12-month change in HbA1c | Univariate model | Initial multivariate model (P < 0.05 in univariate model) | Final multivariate model (step-down method, P < 0.05) | ||||||||
|---|---|---|---|---|---|---|---|---|---|---|---|---|
| N | Mean | SD | Point estimate | 95% CI | Category P value (variable P value) | Point estimate | 95% CI | Category P value (variable P value) | Point estimate | 95% CI | Category P value (variable P value) | |
| *P < 0.05. Factors: study, sex, age (at registration), complications of diabetes (retinopathy, neuropathy, nephropathy), arteriosclerotic disease (cerebrovascular accident, myocardial infarction, angina, arteriosclerosis obliterans), smoking history, drinking history, duration of diabetes, body weight (at the start of treatment), BMI (at the start of treatment), HbA1c (at the start of treatment), and eGFR (at the start of treatment). HbA1c: hemoglobin A1c; SD: standard deviation; CI: confidence interval; NGSP: National Glycohemoglobin Standardization Program; eGFR: estimated glomerular filtration rate. | ||||||||||||
| Intercept | 2,339 | -0.68 | 1.13 | - | - | - | 0.013 | -0.155, 0.182 | 0.876 | 0.021 | -0.111, 0.152 | 0.757 |
| Study | ||||||||||||
| ASSET-K | 1,074 | -0.68 | 1.08 | Reference | - | (0.003*) | Reference | - | (< 0.001*) | Reference | - | (< 0.001*) |
| ASSIST-K | 854 | -0.61 | 1.20 | 0.070 | -0.032, 0.171 | 0.178 | 0.284 | 0.190, 0.378 | < 0.001* | 0.286 | 0.193, 0.379 | < 0.001* |
| ATTEST-K | 411 | -0.84 | 1.10 | -0.165 | -0.293, -0.036 | 0.012* | -0.182 | -0.304, -0.060 | 0.003* | -0.193 | -0.315, -0.071 | 0.002* |
| Age at registration | ||||||||||||
| 56 or younger | 542 | -0.71 | 1.43 | Reference | - | (0.007*) | Reference | - | (< 0.001*) | Reference | - | (< 0.001*) |
| 57 - 64 | 560 | -0.79 | 1.09 | -0.076 | -0.209, 0.058 | 0.266 | -0.236 | -0.356, -0.116 | < 0.001* | -0.234 | -0.353, -0.115 | < 0.001* |
| 65 - 72 | 617 | -0.65 | 0.93 | 0.067 | -0.063, 0.197 | 0.315 | -0.261 | -0.384, -0.137 | < 0.001* | -0.252 | -0.371, -0.132 | < 0.001* |
| 73 or older | 618 | -0.60 | 1.02 | 0.115 | -0.015, 0.245 | 0.082 | -0.220 | -0.351, -0.088 | 0.001* | -0.219 | -0.342, -0.095 | < 0.001* |
| Unknown | 2 | -2.40 | 2.55 | -1.688 | -3.253, -0.123 | 0.035* | -1.547 | -2.919, -0.175 | 0.027* | -1.436 | -2.806, -0.065 | 0.040* |
| Duration of diabetes (years) | ||||||||||||
| Less than 10 years | 713 | -0.77 | 1.26 | Reference | - | (< 0.001*) | Reference | - | (0.007*) | Reference | - | (0.007*) |
| 10 - 19 years | 758 | -0.60 | 1.08 | 0.170 | 0.055, 0.285 | 0.004* | 0.180 | 0.075, 0.285 | < 0.001* | 0.181 | 0.076, 0.286 | < 0.001* |
| 20 years or longer | 480 | -0.59 | 0.88 | 0.174 | 0.044, 0.304 | 0.009* | 0.122 | -0.004, 0.248 | 0.058 | 0.124 | -0.002, 0.251 | 0.053 |
| Unknown | 388 | -0.82 | 1.21 | -0.055 | -0.194, 0.084 | 0.438 | 0.039 | -0.089, 0.167 | 0.547 | 0.046 | -0.082, 0.174 | 0.482 |
| HbA1c at the start of treatment (NGSP, %) | ||||||||||||
| Less than 7.20 | 473 | -0.11 | 0.72 | Reference | - | (< 0.001*) | Reference | - | (< 0.001*) | Reference | - | (< 0.001*) |
| 7.20 - 7.84 | 696 | -0.40 | 0.67 | -0.283 | -0.401, -0.165 | < 0.001* | -0.391 | -0.509, -0.273 | < 0.001* | -0.380 | -0.498, -0.262 | < 0.001* |
| 7.85 - 8.79 | 577 | -0.65 | 0.87 | -0.533 | -0.655, -0.411 | < 0.001* | -0.697 | -0.822, -0.572 | < 0.001* | -0.691 | -0.816, -0.567 | < 0.001* |
| 8.80 or higher | 593 | -1.51 | 1.53 | -1.395 | -1.516, -1.273 | < 0.001* | -1.582 | -1.708, -1.455 | < 0.001* | -1.583 | -1.709, -1.458 | < 0.001* |
| eGFR at the start of treatment (mL/min/1.73 m2) | ||||||||||||
| Less than 63.56 | 441 | -0.66 | 1.03 | Reference | - | (< 0.001*) | Reference | - | (0.094) | |||
| 63.56 - 77.51 | 441 | -0.64 | 0.88 | 0.017 | -0.132, 0.165 | 0.827 | -0.035 | -0.166, 0.097 | 0.607 | |||
| 77.52 - 91.43 | 440 | -0.67 | 1.04 | -0.013 | -0.162, 0.135 | 0.861 | 0.027 | -0.107, 0.161 | 0.694 | |||
| 91.44 or higher | 443 | -0.91 | 1.56 | -0.258 | -0.406, -0.109 | < 0.001* | -0.047 | -0.189, 0.094 | 0.513 | |||
| Unknown | 574 | -0.57 | 1.02 | 0.086 | -0.053, 0.226 | 0.226 | 0.107 | -0.020, 0.235 | 0.099 | |||
| Explanatory variable | 12-month change in body weight | Univariate model | Initial multivariate model (P < 0.05 in univariate model) | Final multivariate model (step-down method, P < 0.05) | ||||||||
|---|---|---|---|---|---|---|---|---|---|---|---|---|
| N | Mean | SD | Point estimate | 95% CI | Category P value (variable P value) | Point estimate | 95% CI | Category P value (variable P value) | Point estimate | 95% CI | Category P value (variable P value) | |
| *P < 0.05. Factors: study, sex, age (at registration), complications of diabetes (retinopathy, neuropathy, nephropathy), arteriosclerotic disease (cerebrovascular accident, myocardial infarction, angina, arteriosclerosis obliterans), smoking history, drinking history, duration of diabetes, body weight (at the start of treatment), BMI (at the start of treatment), HbA1c (at the start of treatment), and eGFR (at the start of treatment). SD: standard deviation; CI: confidence interval; BMI: body mass index; HbA1c: hemoglobin A1c; NGSP: National Glycohemoglobin Standardization Program. | ||||||||||||
| Intercept | 2,065 | -0.01 | 3.54 | - | - | - | 0.623 | 0.181, 1.064 | 0.006* | 0.640 | 0.201, 1.080 | 0.004* |
| Study | ||||||||||||
| ASSET-K | 980 | 0.11 | 2.94 | Reference | - | (0.271) | Reference | - | (0.822) | Reference | - | (0.460) |
| ASSIST-K | 832 | -0.09 | 4.26 | -0.208 | -0.535, 0.119 | 0.212 | -0.125 | -0.519, 0.269 | 0.532 | -0.209 | -0.547, 0.129 | 0.226 |
| ATTEST-K | 253 | -0.23 | 2.98 | -0.339 | -0.828, 0.150 | 0.174 | -0.081 | -0.620, 0.457 | 0.767 | -0.161 | -0.654, 0.332 | 0.522 |
| Hypertension | ||||||||||||
| No | 827 | 0.35 | 3.16 | Reference | - | (< 0.001*) | Reference | - | (0.030*) | Reference | - | (0.029*) |
| Yes | 1,162 | -0.30 | 3.80 | -0.653 | -0.967, -0.339 | < 0.001* | -0.382 | -0.703, -0.060 | 0.020* | -0.390 | -0.710, -0.070 | 0.017* |
| Unknown | 76 | 0.38 | 2.65 | 0.030 | -0.799, 0.858 | 0.944 | 0.323 | -0.661, 1.307 | 0.520 | 0.271 | -0.614, 1.157 | 0.548 |
| Fatty liver | ||||||||||||
| No | 1,466 | 0.11 | 2.91 | Reference | - | (0.023*) | Reference | - | (0.713) | |||
| Yes | 345 | -0.46 | 5.47 | -0.571 | -0.985, -0.156 | 0.007* | -0.199 | -0.686, 0.288 | 0.423 | |||
| Unknown | 254 | -0.11 | 3.48 | -0.225 | -0.695, 0.246 | 0.349 | -0.133 | -0.724, 0.459 | 0.660 | |||
| BMI at the start of treatment | ||||||||||||
| Less than 22.0 | 491 | 0.68 | 2.52 | Reference | - | (< 0.001*) | Reference | - | (< 0.001*) | Reference | - | (< 0.001*) |
| 22.0 - 24.4 | 518 | 0.21 | 2.61 | -0.466 | -0.897, -0.034 | 0.034* | -0.435 | -0.867, -0.002 | 0.049* | -0.443 | -0.875, -0.011 | 0.044* |
| 24.5 - 27.3 | 502 | 0.06 | 2.83 | -0.620 | -1.054, -0.185 | 0.005* | -0.569 | -1.009, -0.128 | 0.011* | -0.586 | -1.024, -0.147 | 0.009* |
| 27.4 or higher | 513 | -0.94 | 5.24 | -1.618 | -2.050, -1.186 | < 0.001* | -1.595 | -2.048, -1.141 | < 0.001* | -1.632 | -2.076, -1.188 | < 0.001* |
| Unknown | 41 | -0.29 | 3.00 | -0.966 | -2.079, 0.147 | 0.089 | -1.051 | -2.224, 0.122 | 0.079 | -1.069 | -2.236, 0.099 | 0.073 |
| HbA1c at the start of treatment (NGSP, %) | ||||||||||||
| Less than 7.30 | 489 | -0.22 | 2.50 | Reference | - | (< 0.001*) | Reference | (< 0.001*) | Reference | - | (< 0.001*) | |
| 7.30 - 7.89 | 520 | 0.13 | 2.88 | 0.353 | -0.083, 0.788 | 0.112 | 0.412 | -0.022, 0.846 | 0.063 | 0.417 | -0.017, 0.851 | 0.060 |
| 7.90 - 8.79 | 517 | -0.41 | 4.54 | -0.188 | -0.624, 0.248 | 0.398 | -0.017 | -0.460, 0.426 | 0.940 | -0.019 | -0.461, 0.424 | 0.935 |
| 8.80 or higher | 539 | 0.42 | 3.76 | 0.635 | 0.204, 1.067 | 0.004* | 0.933 | 0.488, 1.378 | < 0.001* | 0.923 | 0.479, 1.367 | < 0.001* |
| Explanatory variable | 12-month change in eGFR | Univariate model | Initial multivariate model (P < 0.05 in univariate model) | Final multivariate model (step-down method, P < 0.05) | ||||||||
|---|---|---|---|---|---|---|---|---|---|---|---|---|
| N | Mean | SD | Point estimate | 95% CI | Category P value (variable P value) | Point estimate | 95% CI | Category P value (variable P value) | Point estimate | 95% CI | Category P value (variable P value) | |
| *P < 0.05. Factors: study, sex, age (at registration), complications of diabetes (retinopathy, neuropathy, nephropathy), arteriosclerotic disease (cerebrovascular accident, myocardial infarction, angina, arteriosclerosis obliterans), smoking history, drinking history, duration of diabetes, body weight (at the start of treatment), BMI (at the start of treatment), HbA1c (at the start of treatment), and eGFR (at the start of treatment). eGFR: estimated glomerular filtration rate; SD: standard deviation; CI: confidence interval. | ||||||||||||
| Intercept | 1,418 | -4.04 | 13.45 | - | - | - | 4.436 | 2.144, 6.728 | < 0.001* | 4.436 | 2.144, 6.728 | < 0.001* |
| Study | ||||||||||||
| ASSET-K | 673 | -3.88 | 14.94 | Reference | - | (0.885) | Reference | - | (0.760) | Reference | - | (0.760) |
| ASSIST-K | 426 | -4.29 | 13.08 | -0.413 | -2.047, 1.222 | 0.621 | -0.404 | -2.009, 1.201 | 0.622 | -0.404 | -2.009, 1.201 | 0.622 |
| ATTEST-K | 319 | -4.03 | 10.27 | -0.152 | -1.947, 1.643 | 0.868 | 0.291 | -1.474, 2.056 | 0.746 | 0.291 | -1.474, 2.056 | 0.746 |
| Age (at registration) | ||||||||||||
| 57 or younger | 335 | -2.55 | 13.91 | Reference | - | (0.064) | Reference | - | (< 0.001*) | Reference | - | (< 0.001*) |
| 58 - 65 | 354 | -4.34 | 13.78 | -1.792 | -3.800, 0.216 | 0.080 | -4.279 | -6.254, -2.305 | < 0.001* | -4.279 | -6.254, -2.305 | < 0.001* |
| 66 - 73 | 359 | -3.90 | 10.75 | -1.344 | -3.345, 0.657 | 0.188 | -5.059 | -7.090, -3.028 | < 0.001* | -5.059 | -7.090, -3.028 | < 0.001* |
| 74 or older | 370 | -5.24 | 14.90 | -2.685 | -4.672, -0.698 | 0.008* | -7.530 | -9.640, -5.420 | < 0.001* | -7.530 | -9.640, -5.420 | < 0.001* |
| eGFR (at the start of treatment) (mL/min/1.73 m2) | ||||||||||||
| Less than 63.00 | 338 | -1.39 | 8.56 | Reference | - | (< 0.001*) | Reference | - | (< 0.001*) | Reference | - | (< 0.001*) |
| 63.00 - 77.16 | 339 | -2.16 | 10.07 | -0.767 | -2.739, 1.206 | 0.446 | -1.749 | -3.717, 0.218 | 0.081 | -1.749 | -3.717, 0.218 | 0.081 |
| 77.17 - 91.54 | 338 | -3.79 | 9.88 | -2.402 | -4.377, -0.428 | 0.017* | -3.983 | -5.987, -1.980 | < 0.001* | -3.983 | -5.987, -1.980 | < 0.001** |
| 91.55 or higher | 340 | -9.47 | 17.38 | -8.079 | -10.051, -6.108 | < 0.001* | -11.299 | -13.441, -9.156 | < 0.001* | -11.299 | -13.441, -9.156 | < 0.001* |
| Unknown | 63 | -0.37 | 27.71 | 1.021 | -2.501, 4.543 | 0.570 | -0.672 | -4.284, 2.940 | 0.715 | -0.672 | -4.284, 2.940 | 0.715 |