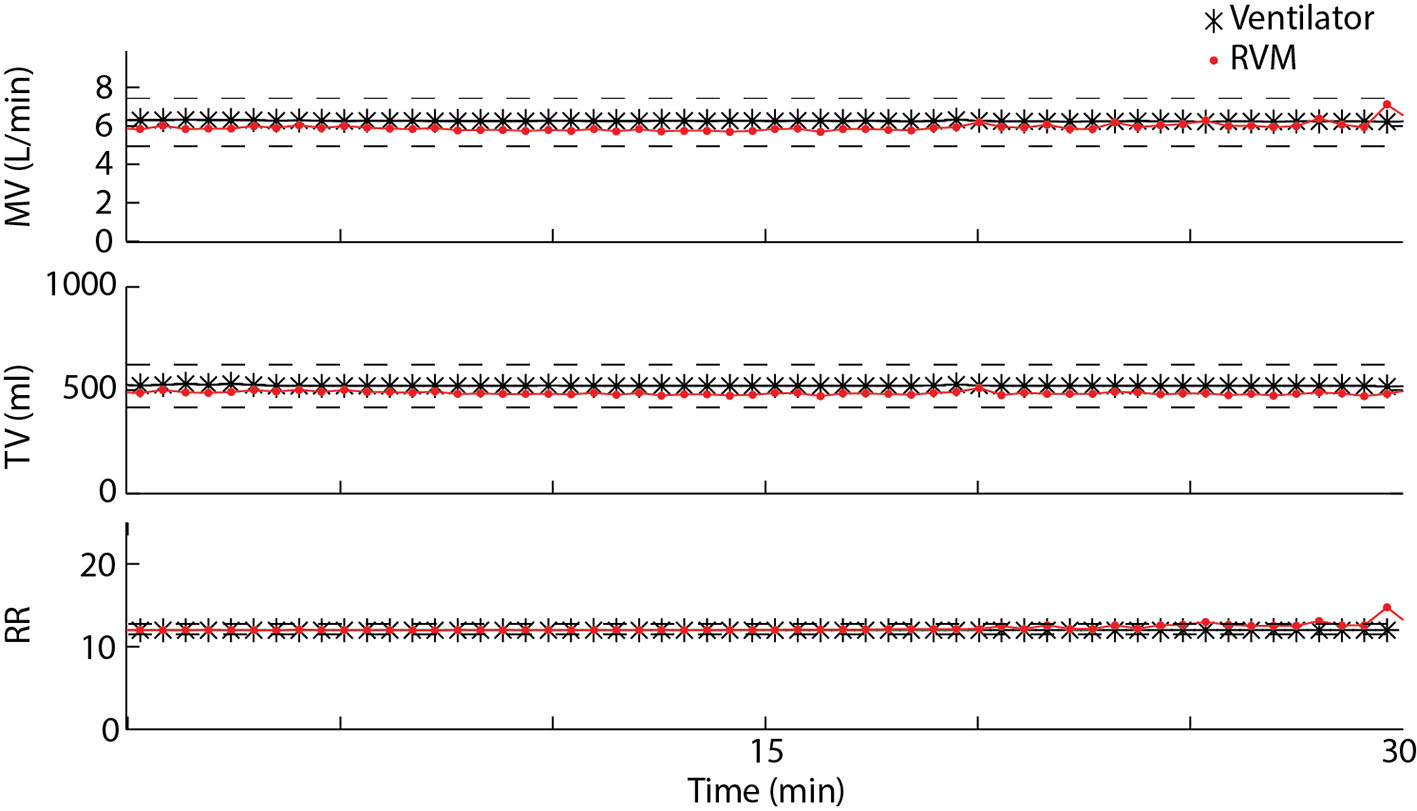
Figure 1. Measured MV, TV, and RR over a 30-min period using RVM (red) and the Puritan Bennett ventilator in SimV mode (black) for one example patient. Average errors between RVM and the ventilator for MV, TV, and RR are less than 10%.
| Journal of Clinical Medicine Research, ISSN 1918-3003 print, 1918-3011 online, Open Access |
| Article copyright, the authors; Journal compilation copyright, J Clin Med Res and Elmer Press Inc |
| Journal website http://www.jocmr.org |
Original Article
Volume 9, Number 1, January 2017, pages 17-22
Use of a Respiratory Volume Monitor to Assess Respiratory Competence in Cardiac Surgery Patients After Extubation
Figures
Tables
| Sex | Age (years) | BMI (kg/m2) | Procedure | |
|---|---|---|---|---|
| 1 | Female | 81 | 29.0 | AVR |
| 2 | Male | 84 | 23.7 | CABG |
| 3 | Male | 60 | 26.9 | CABG × 4 |
| 4 | Male | 80 | 33.1 | CABG × 3 |
| 5 | Male | 72 | 25.8 | CABG |
| 6 | Male | 53 | 38.5 | Septal Myectomy |
| 7 | Male | 59 | 30.5 | AVR |
| 8 | Male | 84 | 19.5 | CABG × 4 |
| 9 | Male | 58 | 42.0 | AVR |
| 10 | Male | 82 | 24.5 | CABG × 3 |
| 11 | Female | 52 | 28.0 | AVR |
| 12 | Female | 73 | 27.0 | CABG |
| 13 | Male | 63 | 26.6 | CABG × 3 |
| 14 | Female | 66 | 24.2 | Septal myectomy |
| TV (mL) | RR (breaths/min) | MV (L/min) | |
|---|---|---|---|
| Pre-extubation | 520 ± 40 | 17.1 ± 1.5 | 8.2 ± 0.4 |
| Post-extubation | 370 ± 40 | 17.5 ± 1.0 | 6.4 ± 0.9 |
| P | < 0.01 | 0.4 | < 0.05 |
| PCO2 (mm Hg) | PaO2 (mm Hg) | Bicarbonate (mEq/L) | SpO2 (%) | pH | PCO2 (mm Hg) |
|---|---|---|---|---|---|
| N | 12 | 12 | 12 | 12 | 8 |
| Pre-extubation | 39.0 ± 1.8 | 138 ± 10 | 21.3 ± 0.5 | 99 ± 0.4 | 7.38 ± 0.02 |
| Post-extubation | 41.8 ± 1.1 | 136 ± 9 | 22.3 ± 0.4 | 98 ± 0.8 | 7.34 ± 0.01 |
| P-value | 0.11 | 0.78 | 0.04 | 0.21 | 0.56 |