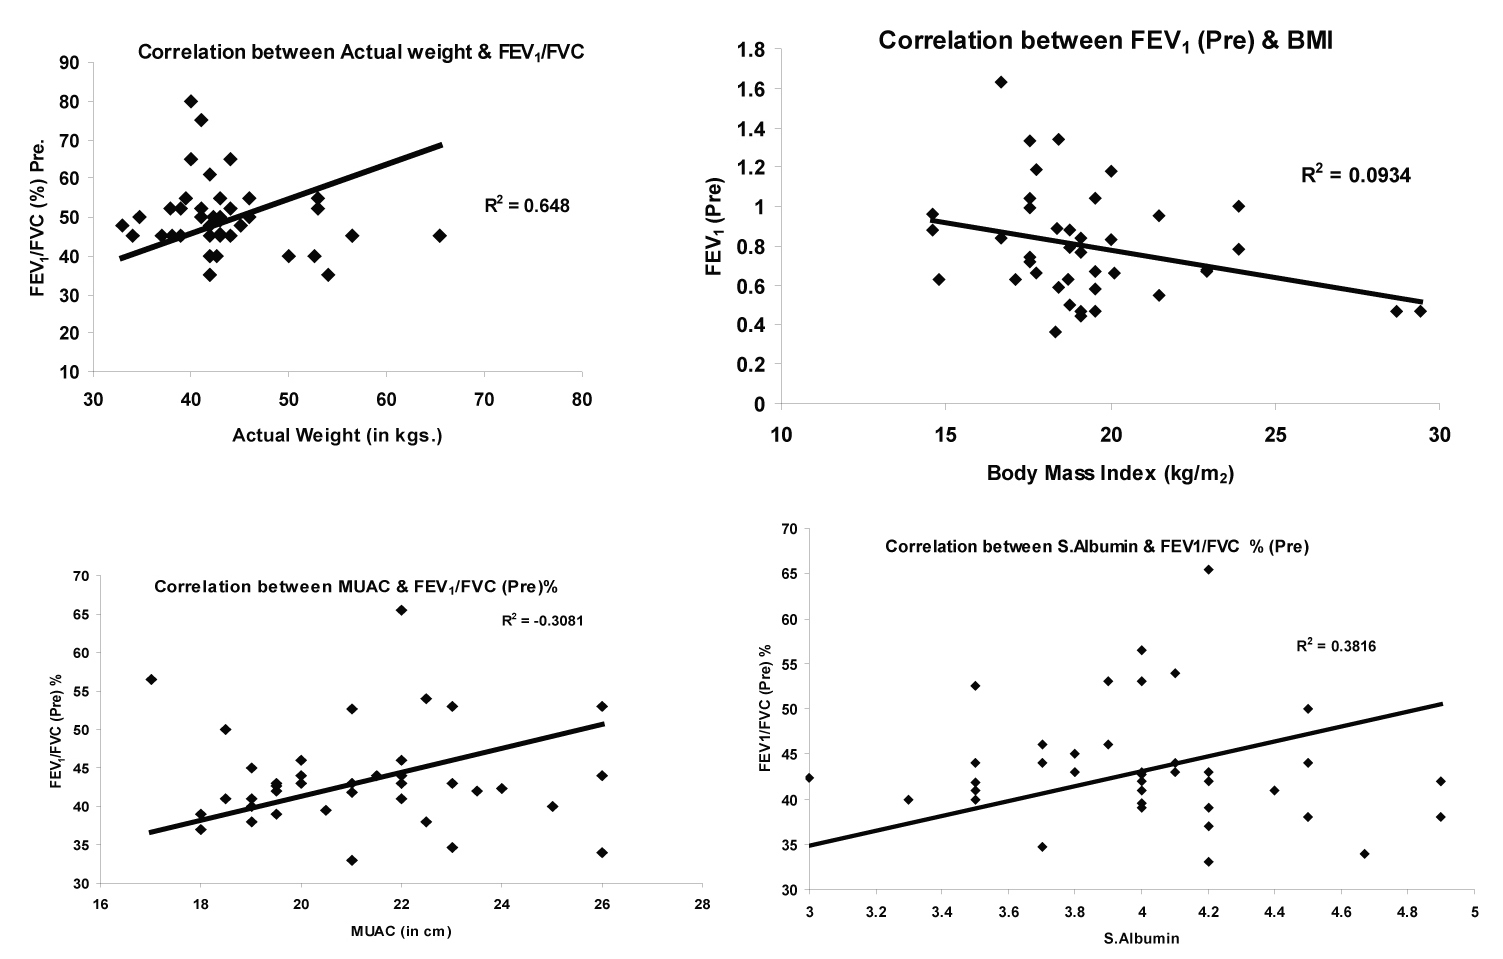
Figure 1. Correlation between lung function and nutrition status.
| Journal of Clinical Medicine Research, ISSN 1918-3003 print, 1918-3011 online, Open Access |
| Article copyright, the authors; Journal compilation copyright, J Clin Med Res and Elmer Press Inc |
| Journal website http://www.jocmr.org |
Original Article
Volume 2, Number 2, April 2010, pages 68-74
Nutritional Status of Chronic Obstructive Pulmonary Disease Patients Admitted in Hospital With Acute Exacerbation
Figures
Tables
| Patient Characteristic | Description |
|---|---|
| * For females only | |
| Age in years (Mean ± SD) | 56.75 ± 10.36 |
| Male/Female Ratio | 73/10 |
| Type of Residence N (%) | |
| Rural | 47(56.62) |
| Urban | 36(43.37) |
| Smoking History N (%) | |
| Non smokers | 15 (18.07) |
| Current smokers | 28 (33.73) |
| Former smokers | 40 (48.19) |
| Smoking Index (Mean ± SD) | 361.33 ± 39.11 |
| Pack year (Mean ± SD) | 7.85 ± 5.03 |
| Exposure to domestic smoke* N (%) | 10 (12.04) |
| Hours of exposure to domestic smoke (Mean ± SD) | 3.11 ± 0.23 |
| Lung Function | Males | Females | Normal values |
|---|---|---|---|
| Data represented as Mean ± SDFEV1 (Pre) = Forced expiratory volume in one second before bronchodilator;FEV1 (Pre) = Forced expiratory volume in one second after bronchodilator; % predicted = expressed as percentage of the predicted value;FEV/ FVC (%) = FEV1 expressed as % of inspiratory vital capacity | |||
| Spirometry | |||
| FVC (Pred.) (lit.) | 2.95 ± 0.69 | 2.8 ± 0.57 | |
| FVC (Pre) (lit.) | 1.82 ± 0.5 | 1.7 ± 0.23 | |
| FVC (Post) (lit.) | 2.07 ± 0.57 | 1.92 ± 0.11 | |
| FEV1(Pred.) (lit.) | 2.37 ± 0.56 | 2.27 ± 0.44 | |
| FEV1(Pre) (lit.) | 0.79 ± 0.27 | 0.72 ± 0.09 | |
| FEV1(Post) (lit.) | 0.9 ± 0.28 | 0.81 ± 0.04 | |
| FEV1/FVC % (Pre) | 45.36 ± 6.36 | 42.33 ± 0.57 | |
| ABG Analysis | |||
| pH | 7.35 ± 0.11 | 7.36 ± 0.06 | 7.35 - 7.45 |
| pO2 | 57.99 ± 14.59 | 49.03 ± 13.96 | 35 - 45 mm Hg |
| pCO2 | 64.07 ± 7.28 | 70.03 ± 11.93 | 80 - 100 mmHg |
| SO2 % | 84.06 ± 12.18 | 78.2 ± 21.69 | 95 - 100% |
| CHCO3 | 35.16 ± 7.12 | 41.7 ± 12.99 | 22 - 26 m/Eq/L |
| Anthropometry | Males | Females | Normal values |
|---|---|---|---|
| Data represented as Mean ± SDBMI Body Mass Index; MUAC Mid Upper Arm Circumference. | |||
| Actual weight (kg) | 50.03 ± 9.23 | 47.66 ± 4.04 | |
| Usual weight (kg) | 68.23 ± 9.80 | 58.23 ± 4.72 | |
| % Weight loss in previous six months Median (range) | 5.9 (0 - 6.7) | 4.5 (0 - 5.3) | |
| BMI (kg/m2) | 20.22 ± 2.57 | 19.38 ± 3.11 | |
| MUAC (cm) | 21.18 ± 2.31 | 21.03 ± 2.57 | 27.4 - 35.5 |
| Parameters | Males | Females | Normal Values |
|---|---|---|---|
| Data represented as Mean ± SDRBS, Random Blood Sugar; FBS, Fasting Blood Sugar; PPS, Post Prandial Sugar; TLC, Total Leukocyte Count. | |||
| Physiological | |||
| Pulse Rate | 93.75 ± 8.69 | 94.0 ± 2.0 | 70 - 78 |
| Systolic | 125 ± 21 | 126 ± 23 | 120 mm |
| Diastolic | 79.0 ± 13.0 | 90.0 ± 0.0 | 80 mm |
| Respiratory Rate | 23.77 ± 2.87 | 23.33 ± 2.33 | 14-18 breaths/min |
| Biochemical | |||
| Hemoglobin g/dl | 13.24 ± 2.72 | 13.4 ± 2.98 | 13.5-18.0 for males 11.5 - 16.5 for females |
| TLC mm3 | 13379 ± 2180.3 | 11166.0 ± 1240.33 | 4000 - 10,000 mm3 |
| Blood Sugar level | |||
| RBS mg/dl | 117 ± 45.24 | 105 ± 45.8 | 70 - 160 mg/dl |
| FBS mg/dl | 106.89 ± 50.41 | 112.33 ± 62.06 | 70 - 110 mg/dl |
| PPS mg/dl | 146.58 ± 58.24 | 154.66 ± 77.82 | 110 - 160 mg/dl |
| T.Protein g/dl | 6.37 ± 0.63 | 7.16 ± 0.35 | 6.0 - 8.0 g/dl |
| S.Albumin g/dl | 4.09 ± 0.40 | 4.4 ± 0.43 | 3.5 - 5.5 g/dl |
| S.Urea mg/dl | 37.72 ± 2.03 | 47.66 ± 10.74 | 10 - 45 mg/dl |
| S.Creatinine mg/dl | 1.22 ± 0.08 | 0.9 ± 0.28 | < 1.5 mg/dl |
| S.Bilirubin mg/dl | 0.82 ± 0.01 | 0.86 ± 0.14 | Upto 1.0 mg/dl |
| S.Sodium m/Eq/L | 130.95 ± 46.55 | 130.66 ± 5.77 | 135 - 145 m/Eq/L |
| S.Potassium m/Eq/L | 4.44 ± 4.59 | 4.76 ± 0.75 | 3.5 - 5.0 m/Eq/L |
| S.Calcium mg/dl | 3.31 ± 1.62 | 3.4 ± 1.97 | 8.5 - 10.5 mg/Dl |