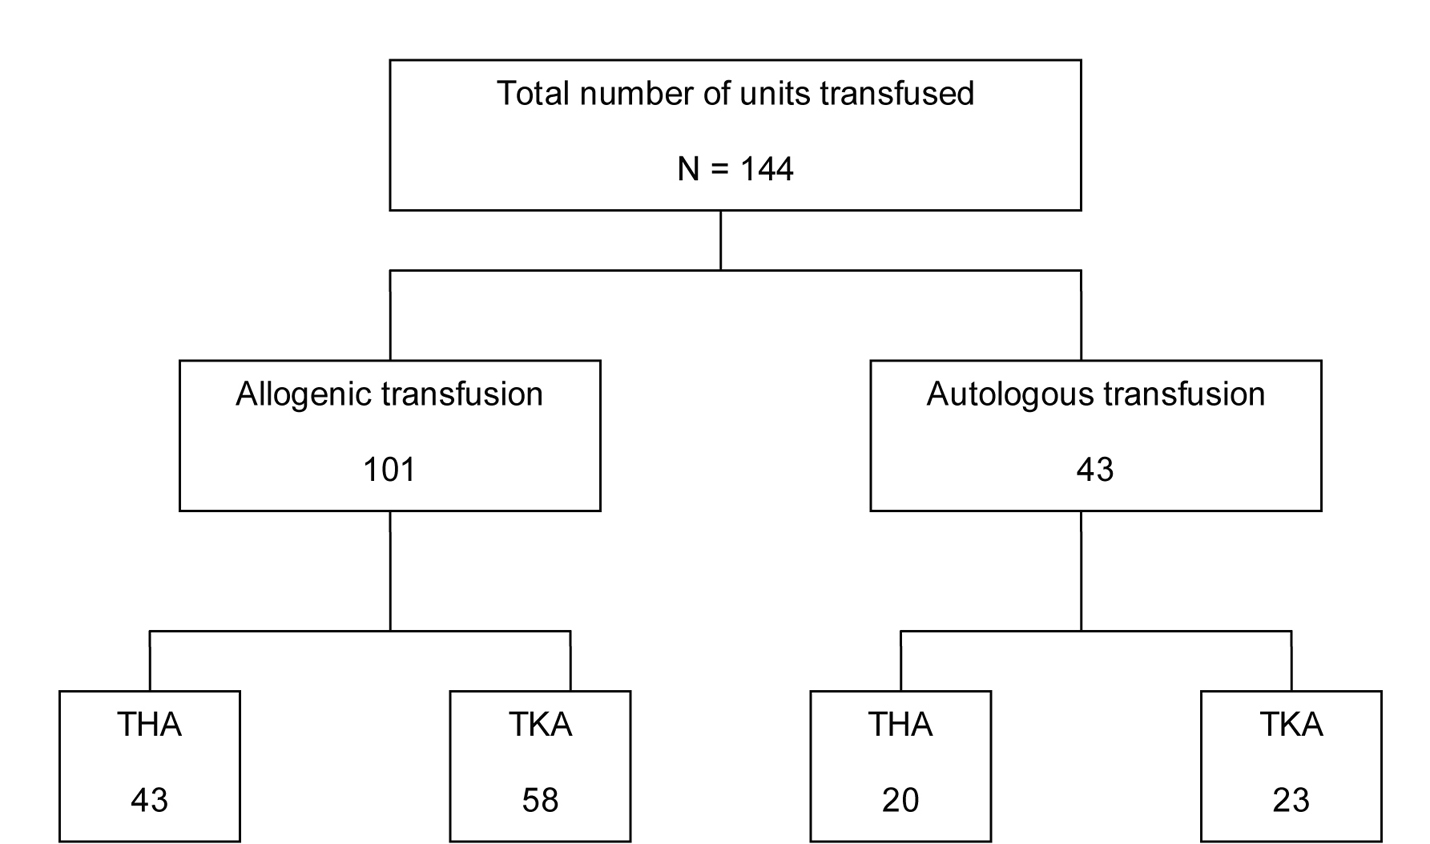
Figure 1. Blood transfusion requirements. THA (total hip arthroplasty), TKA (total knee arthroplasty).
| Journal of Clinical Medicine Research, ISSN 1918-3003 print, 1918-3011 online, Open Access |
| Article copyright, the authors; Journal compilation copyright, J Clin Med Res and Elmer Press Inc |
| Journal website http://www.jocmr.org |
Original Article
Volume 1, Number 5, December 2009, pages 267-273
Blood Transfusion Practices in Total Joint Arthroplasties in Jamaica
Figures
Tables
| Variable | Odds Ratio | 95% CI | P-value |
|---|---|---|---|
| N = 102 patients with non-missing values. | |||
| Gender (M vs F) | 0.544 | 0.153 - 1.936 | 0.347 |
| Age | 1.005 | 0.960 - 1.053 | 0.815 |
| Pre-op Hb | 1.289 | 0.865 - 1.921 | 0.212 |
| BMI | 1.046 | 0.932 - 1.174 | 0.447 |
| Duration of surgery | 1.005 | 0.995 - 1.015 | 0.354 |
| Est. blood loss | 1.002 | 1.001 - 1.003 | 0.000* |
| Type of anaesthesia | |||
| Regional vs General | 2.033 | 0.620 - 6.668 | 0.242 |
| Combined vs General | 1.026 | 0.220 - 4.785 | 0.974 |
| Variable | Odds Ratio | 95% CI | P Value |
|---|---|---|---|
| N = 68 patients with non-missing values and who did not donate blood. | |||
| Gender (M vs F) | 0.277 | 0.032 - 2.393 | 0.243 |
| Age | 1.015 | 0.951 - 1.084 | 0.651 |
| Pre-op Hb | 0.777 | 0.413 - 1.463 | 0.435 |
| BMI | 1.107 | 0.954 - 1.286 | 0.181 |
| Duration of surgery | 1.007 | 0.993 - 1.022 | 0.329 |
| Est. blood loss | 1.002 | 1.001 - 1.004 | 0.002* |
| Type of anaesthesia | |||
| Regional vs General | 2.568 | 0.554 - 11.889 | 0.228 |
| Combined vs General | 1.474 | 0.042 - 5.285 | 0.544 |
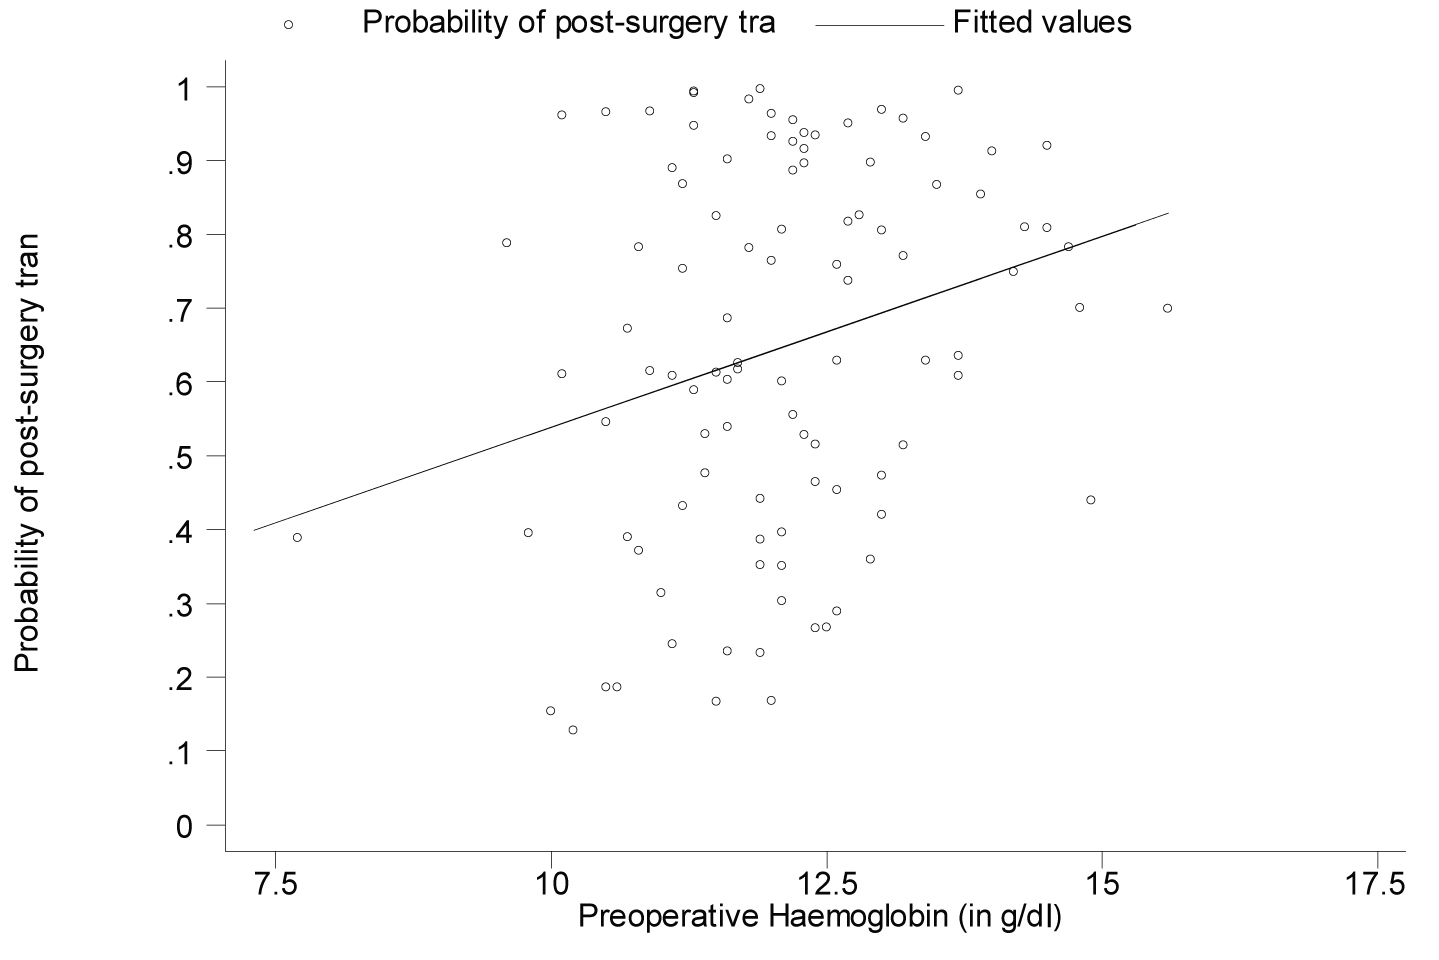
| Was patient transfused? | Number of patients | Pre-operative Hemoglobin | ||||
|---|---|---|---|---|---|---|
| Mean | Standard Deviation | 95% CI | P-value | |||
| All Patients: | 0.359 | |||||
| No | 43 | 11.9 | 1.3 | 11.5 - 12.3 | ||
| Yes | 75 | 12.1 | 1.4 | 11.8 - 12.4 | ||
| Females only | 0.094 | |||||
| No | 32 | 11.5 | 1.0 | 11.1 - 11.9 | ||
| Yes | 58 | 11.9 | 1.3 | 11.6 - 12.3 | ||
| Males only | 0.555 | |||||
| No | 11 | 13.0 | 1.2 | 12.2 - 13.9 | ||
| Yes | 17 | 12.7 | 1.5 | 11.9 - 13.5 | ||
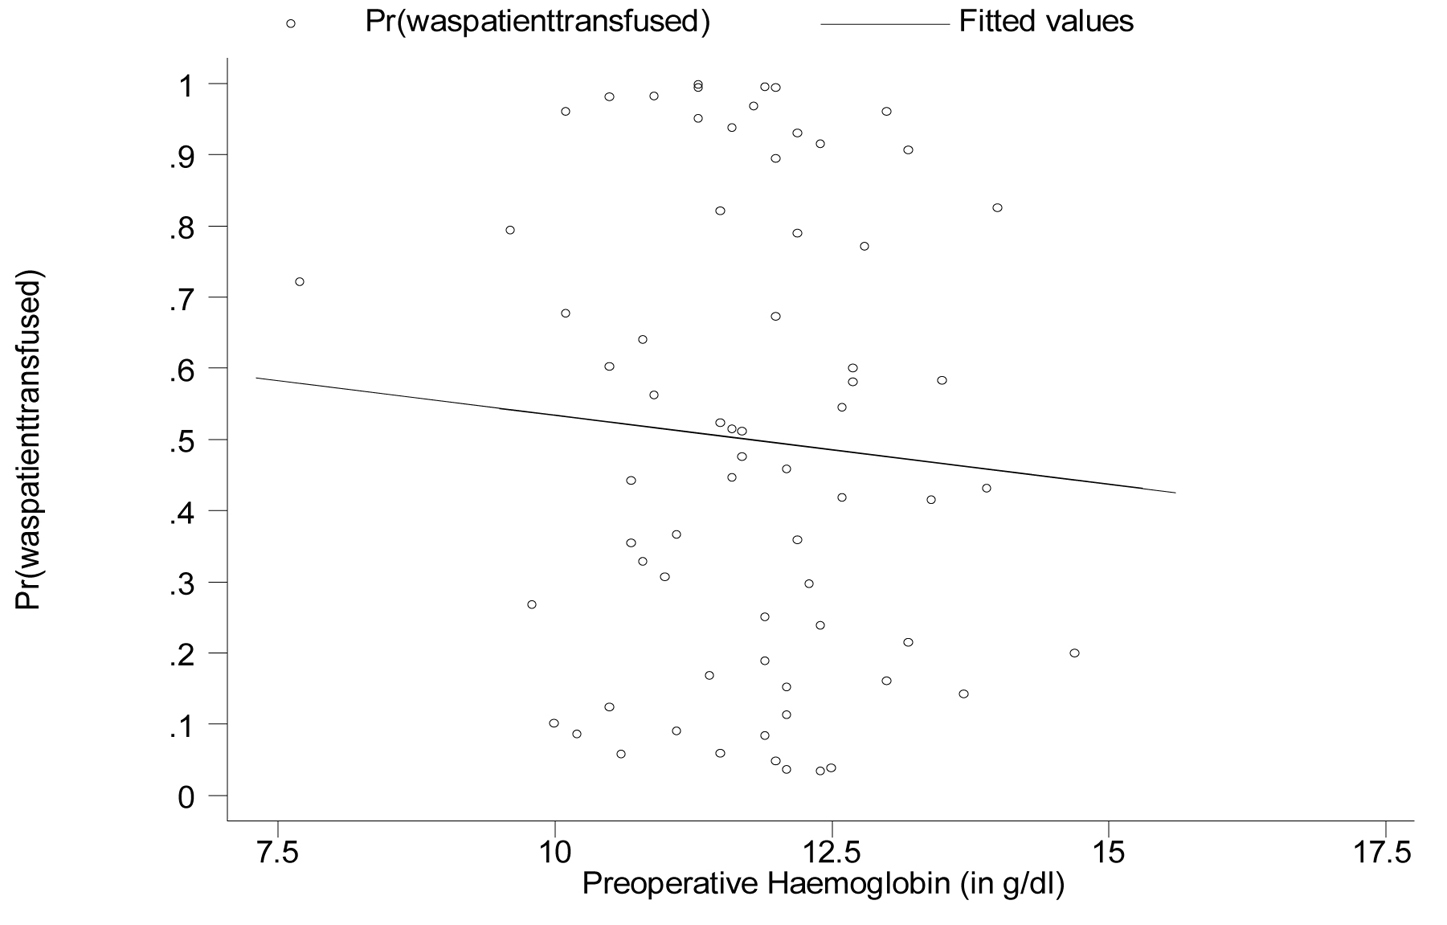
| Was patient transfused? | Number of patients | Pre-operative Hemoglobin | |||
|---|---|---|---|---|---|
| Mean | Standard Deviation | 95% CI | P-value | ||
| All Patients: | 0.462 | ||||
| No | 40 | 11.9 | 1.3 | 11.5 - 12.3 | |
| Yes | 42 | 11.7 | 1.3 | 11.2 - 12.1 | |
| Females only | 0.730 | ||||
| No | 31 | 11.5 | 1.0 | 11.1 - 11.9 | |
| Yes | 37 | 11.6 | 1.3 | 11.2 - 12.1 | |
| Males only | 0.154 | ||||
| No | 9 | 13.1 | 1.4 | 12.1 - 14.2 | |
| Yes | 5 | 12.0 | 1.3 | 10.3 - 13.6 | |