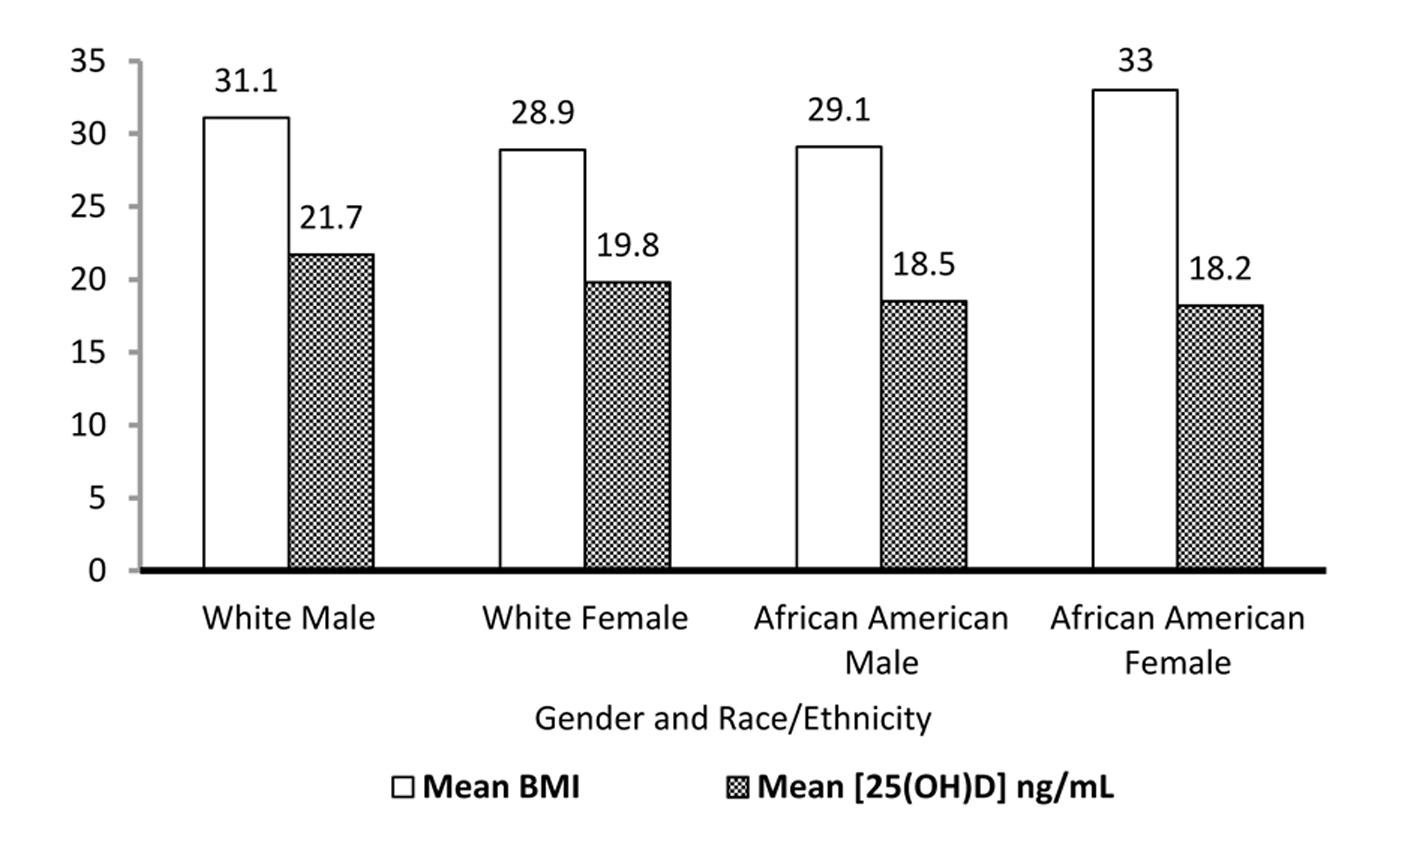
Figure 1. Mean serum 25(OH)D concentration and BMI of population with vitamin D insufficiency categorized by gender and race/ethnicity.
| Journal of Clinical Medicine Research, ISSN 1918-3003 print, 1918-3011 online, Open Access |
| Article copyright, the authors; Journal compilation copyright, J Clin Med Res and Elmer Press Inc |
| Journal website http://www.jocmr.org |
Original Article
Volume 6, Number 6, December 2014, pages 469-475
Incidence of Vitamin D Insufficiency in Coastal South-Eastern US Patient Population With Cardiovascular Disease
Figure
Tables
| Variable | Total population (n = 204) | Population with 25(OH)D insufficiency (n = 109) | Population without 25(OH)D insufficiency (n = 95) |
|---|---|---|---|
| *Mean ± SD (all such values). †Data expressed as number (%). | |||
| Age (years) | 63.3 ± 11.9* | 61.6 ± 13.1* | 65.3 ± 10.1* |
| Gender | |||
| Male | 80 (39.2)† | 42 (38.5)† | 38 (40)† |
| Female | 124 (60.8) | 67 (61.5) | 57 (60) |
| Race/ethnicity | |||
| White | 164 (80.4) | 79 (72.5) | 85 (89.5) |
| African American | 35 (17.2) | 26 (23.9) | 9 (9.5) |
| Other | 5 (2.4) | 4 (3.7) | 1 (1.1) |
| BMI range | |||
| Normal (< 25) | 35 (17.2) | 15 (13.8) | 20 (21.2) |
| Overweight (≥ 25) | 169 (82.8) | 94 (86.2) | 75 (78.9) |
| BMI (kg/m2) | 29.5 ± 5.4 | 30.2 ± 5.5 | 28.8 ± 5.4 |
| Serum 25(OH)D (ng/mL) | 28.3 ± 10.9 | 20.1 ± 6.0 | 37.8 ± 6.9 |
| Variable | Mean vitamin D serum level | Deficiency (< 20 ng/mL) | Insufficiency (< 30 ng/mL) |
|---|---|---|---|
| *Mean ± SD (all such values). †Data expressed as number (%). | |||
| Gender | |||
| Male | 21.4 ± 5.7* | 15 (37.5)† | 27 (64.3)† |
| Female | 19.4 ± 5.9 | 32 (47.8) | 35 (52.2) |
| Race/ethnicity | |||
| White | 20.5 ± 5.7 | 34 (43.0) | 45 (57.0) |
| African American | 18.3 ± 6.7 | 13 (50.0) | 13 (50.0) |
| Other | 22.2 ± 2.7 | 0 (0.0) | 4 (100.0) |
| Gender & race/ethnicity | |||
| White male | 21.7 ± 5.8 | 10 (31.2) | 22 (68.8) |
| White female | 19.8 ± 5.7 | 24 (51.1) | 23 (48.9) |
| African American male | 18.5 ± 6.5 | 5 (55.6) | 4 (44.4) |
| African American female | 18.2 ± 7.1 | 8 (47.1) | 9 (52.9) |