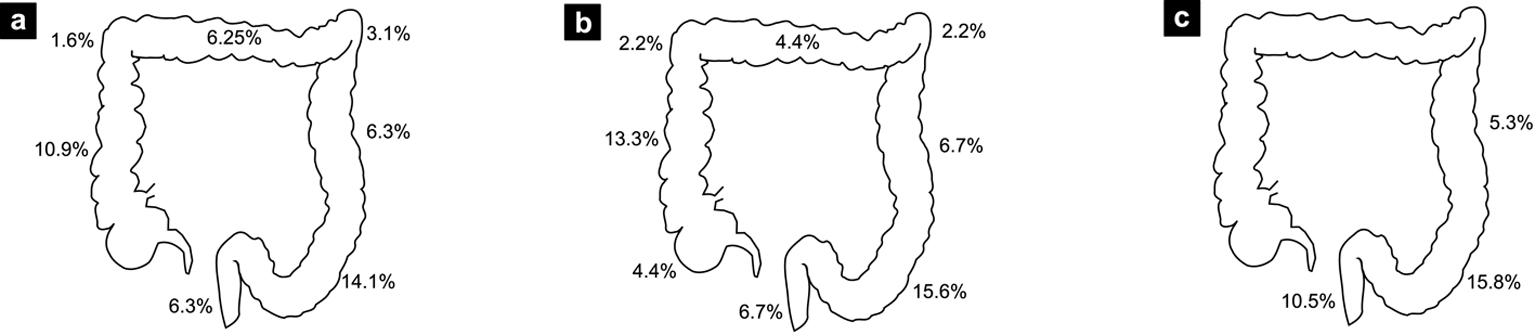
Figure 1. Percentage of patients with at least one lesion found at specific colon sites. (a) All colonoscopies. (b) Screening colonoscopies. (c) Patients under age of 50.
| Journal of Clinical Medicine Research, ISSN 1918-3003 print, 1918-3011 online, Open Access |
| Article copyright, the authors; Journal compilation copyright, J Clin Med Res and Elmer Press Inc |
| Journal website http://www.jocmr.org |
Original Article
Volume 6, Number 6, December 2014, pages 414-421
Importance of Pre-Transplant Colonoscopy in Renal Transplant Recipients
Figures
Tables
| Global population % (n = 159) | Colonoscopy % (n = 64) | No colonoscopy % (n = 95) | P value | |
|---|---|---|---|---|
| P value: comparison between “colonoscopy” and “no colonoscopy”. | ||||
| Male | 64.2 (102) | 75 (48) | 56.8 (54) | < 0.05 |
| Age at transplant (years), mean and standard deviation | 48.1 (SD 12.5) | 55.6 (SD 8.7) | 43.1 (SD 12.1) | < 0.05 |
| ≥ 50 years old | 48.4 (77) | 70.3 (45) | 33.7 (32) | < 0.01 |
| Body mass index (kg/m2), mean and standard deviation | 26.3 (SD 5.5) | 28.3 (5.3) | 24.9 (5.3) | < 0.01 |
| Type II diabetes | 15.7 (25) | 29.7 (19) | 6.3 (6) | < 0.01 |
| Diabetic nephropathy | 13.2 (21) | 23.4 (15) | 6.3 (6) | < 0.05 |
| Dyslipidemia treated with statins | 49.1 (78) | 60.9 (39) | 41.1 (39) | < 0.05 |
| Dialysis | 88.7 (141) | 90.6 (58) | 87.4 (83) | 0.70 |
| Immunosuppressive use | 14.5 (23) | 17.2 (11) | 12.6 (12) | 0.57 |
| Polyps n = 21 (%) | No polyps n = 43 (%) | P value | |
|---|---|---|---|
| Male | 76.2 (16) | 74.4 (32) | 0.88 |
| Age at transplant (years), mean and standard deviation | 57.3 (SD 6.5) | 54.8 (SD 9.5) | 0.21 |
| ≥ 50 years old | 76.2 (16) | 76.7 (33) | 0.96 |
| Body mass index (kg/m2), mean and standard deviation | 27.6 (SD 5.2) | 28.7 (SD 5.4) | 0.47 |
| Type II diabetes | 28.6 (6) | 30.2 (13) | 0.88 |
| Diabetic nephropathy | 28.6 (6) | 20.9 (9) | 0.54 |
| Dyslipidemia treated with statins | 57.1 (12) | 62.8 (27) | 0.87 |
| Dialysis | 90.5 (19) | 90.7 (39) | 0.98 |
| Time elapsed between start of dialysis and colonoscopy and standard deviation | 2.40 (SD 3.17) | 1.90 (SD 2.98) | 0.62 |
| 95% CI (0.65 - 4.16) | 95% CI (0.7 - 3.10) | ||
| Immunosuppressive use | 9.5 (2) | 20.9 (9) | 0.43 |
| Colonoscopies in < 50 years old (n = 19) | Colonoscopies in ≥ 50 years old (n = 45) | |
|---|---|---|
| There were no statistically significant differences between the groups. | ||
| Screening colonoscopy % (n = 45) | 57.9 (11) | 75.6 (34) |
| % of patients with polyps (n = 21) | 26.3 (5) | 35.6 (16) |
| Adenomas % (n = 14) | 15.8 (3) | 24.4 (11) |
| All patient with a colonoscopy % (n = 64) | Screening colonoscopies % (n = 45) | Diagnostic colonoscopies % (n = 19) | Patients with polyps % (n = 21) | |
|---|---|---|---|---|
| % of patients with polyps | 32.8 (21) | 33.3 (15) | 31.6 (6) | 100 (21) |
| Polyps ≥ 10 mm | 6.3 (4) | 6.7 (3) | 5.3 (1) | 21.1 (4) |
| Adenomas | 21.9 (14) | 24.4 (11) | 15.8 (3) | 66.7 (14) |
| Hyperplastic polyps | 4.7 (3) | 4.4 (2) | 5.3 (1) | 9.5 (2) |
| Unknown pathology | 6.3 (4) | 4.4 (2) | 10.5 (2) | 19 (4) |
| Patients with multiple polyps (≥ 2) | 20.3 (13) | 20 (9) | 21.1 (4) | 61.9 (13) |
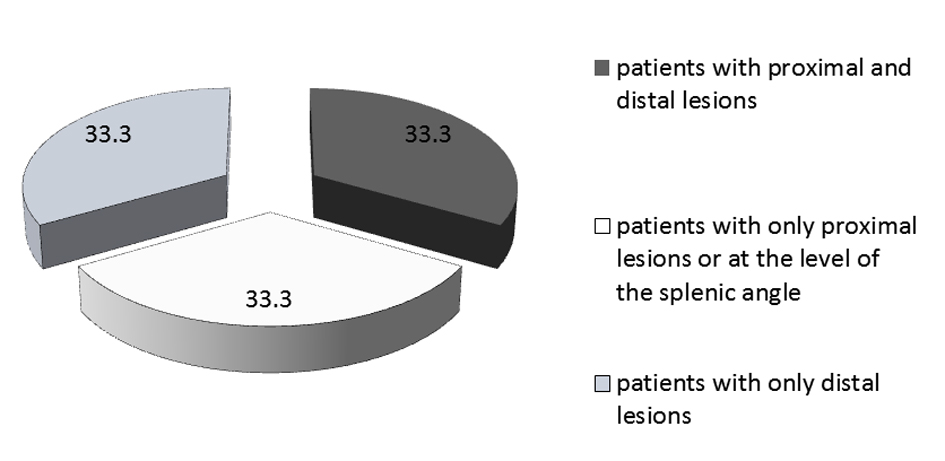
| Patients with only distal polyps | 10.3 (7) | 15.6 (7) | 0 | 33.3 (7) |
| Patients with only proximal polyps | 10.3 (7) | 8.9 (4) | 15.8 (3) | 33.3 (7) |
| Patients with synchronous polyps | 10.3 (7) | 8.9 (4) | 15.3 (3) | 33.3 (7) |
| Diverticulosis | 40.6 (26) | 46.7 (21) | 26.3 (5) | 33.3 (7) |
| Angiodysplasia | 4.7 (3) | 4.4 (2) | 5.3 (1) | 4.8 (1) |