Journal of Clinical Medicine Research, ISSN 1918-3003 print, 1918-3011 online, Open Access
Article copyright, the authors; Journal compilation copyright, J Clin Med Res and Elmer Press Inc
Journal website http://www.jocmr.org

Original Article

Volume 6, Number 6, December 2014, pages 443-450


Correlation Between Serum Uric Acid and Renal Function in Patients With Stable Coronary Artery Disease and Type 2 Diabetes

Figure

Figure 1.
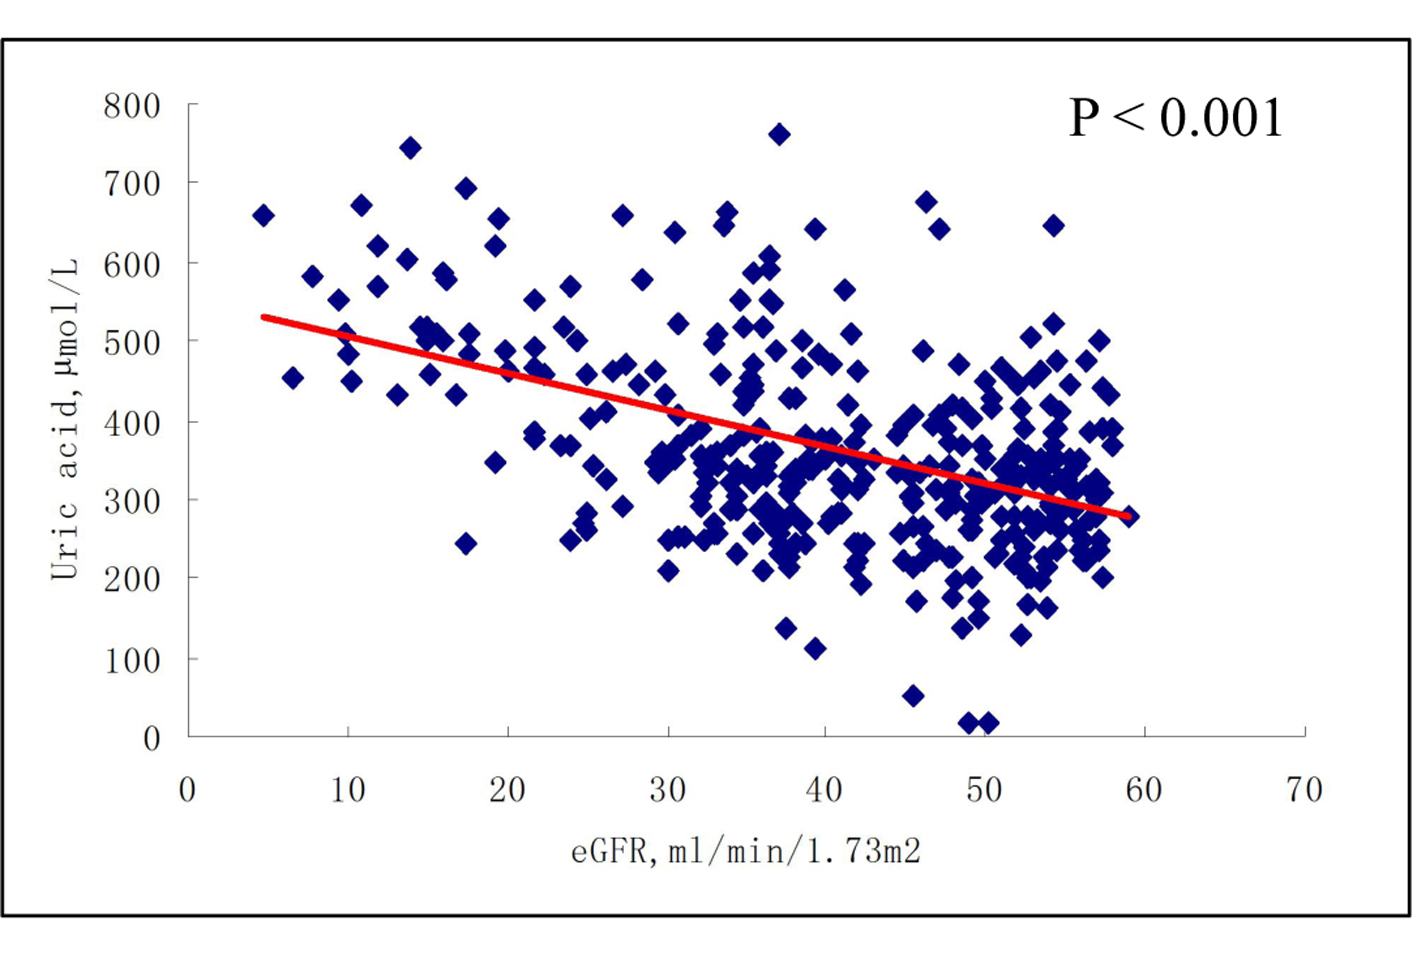
Figure 1. Serum uric acid levels according to the grade of eGFR. Data are shown as means ± SE with no adjustment; P = 0.002 for trend. 1: eGFR ≥ 90 mL/min/1.73 m2; 2: eGFR 60 - 89 mL/min/1.73 m2; 3: eGFR 30 - 59 mL/min/1.73 m2; 4: eGFR < 30 mL/min/1.73 m2.

Tables

Table 1. Baseline Characteristics of Diabetic Patients With Stable CAD According to Uric Acid Quartiles
 
VariablesUric acid
Q1 (n = 132)Q2 (n = 131)Q3 (n = 132)Q4 (n = 131)
P < 0.05, P < 0.001 compared with Q1. ACEI: angiotension converting enzyme inhibitor; Apo A1: apolipoprotein A1; Apo B: apolipoprotein B; CAD: coronary artery disease; eGFR: estimated glomerular filtration rate; FBS: fasting blood sugar; HDL-C: high-density lipoprotein cholesterol; LDL-C: low-density lipoprotein cholesterol.
Uric acid, µmol/L189 (< 246)278 (247 - 307)334 (308 - 365)468 (> 365)
Age, years (mean ± SD)67.42 ± 10.4968.23 ± 8.9769.45 ± 9.9772.16 ± 9.61
Male, n (%)55 (41.70)62 (47.30)63 (47.70)77 (58.80)
Smoking, n (%)29 (22.00)35 (26.70)35 (26.50)34 (26.00)
Hypertension, n (%)96 (72.70)109 (83.20)105 (79.50)114 (87.00)
HbA1C (%)8.35 ± 3.418.36 ± 3.158.38 ± 3.288.37 ± 3.64
FBS, mmol/L6.77 ± 4.106.75 ± 4.276.78 ± 3.876.81 ± 4.23
Hemoglobin, g/L127.69 ± 23.86127.36 ± 30.69127.71 ± 31.79122.69 ± 29.03
Serum creatinine, µmol/L72.14 ± 35.1680.78 ± 40.4483.41 ± 30.21*116.83 ± 62.05
eGFR, mL/min/1.73 m252.27 ± 18.7153.06 ± 16.1052.39 ± 15.7945.17 ± 16.76*
Insulin (%)47 (35.60)50 (38.20)42 (31.80)42 (32.10)
Anti-diabetic pills (%)89 (67.40)80 (61.10)89 (67.40)82 (62.60)
Diuretic (%)13 (9.80)22 (16.80)20 (15.20)46 (35.1)
ACEI (%)68 (51.50)75 (57.30)79 (59.80)71 (54.20)
Statins (%)99 (75.00)101 (77.10)102 (77.30)96 (73.30)
HDL-C, mmol/L1.13 ± 0.421.00 ± 0.31*1.04 ± 0.361.02 ± 0.33
LDL-C, mmol/L2.74 ± 1.112.54 ± 0.972.85 ± 1.652.23 ± 0.94
Total cholesterol, mmol/L3.97 ± 1.544.01 ± 1.484.02 ± 1.514.01 ± 1.55
apo A1, g/L1.04 ± 0.240.97 ± 0.29*1.00 ± 0.320.90 ± 0.32
apo B, g/L0.79 ± 0.280.74 ± 0.270.80 ± 0.370.68 ± 0.26
apo B/apo A10.77 ± 0.250.78 ± 0.240.81 ± 0.250.78 ± 0.22


Table 2. Adjusted ORs and 95% CIs for eGFR < 60 mL/min/1.73 m2 According to Uric Acid Quartiles
 
eGFR < 60 mL/min/1.73 m2ORs (95% CI)
Q1Q2Q3Q4
*P < 0.05, P < 0.01. Model 1 no adjustment. Model 2 adjusted for age, gender, smoking, hypertension and diuretic. Model 3 further adjusted for insulin, diabetic pills, diuretic, ACEI, statins, LDL-C, apo A1 and apo B. Model 4 no adjustment. Model 5 adjusted for age, gender, smoking, hypertension and diuretic. Model 6 further adjusted for insulin, diabetic pills, diuretic, ACEI, statins, LDL-C, apo A1 and apo B. CI: confidence interval; ORs: odds ratios; other abbreviations see Table 1.
Model 11.00.96 (0.54 - 1.70)2.23 (1.20 - 4.16)*9.18 (4.01 - 21.01)
Model 21.00.98 (0.56 - 1.71)2.20 (1.19 - 4.07)*8.98 (3.95 - 20.43)
Model 31.00.85 (0.51 - 1.40)2.01 (1.19 - 3.66)*7.01 (3.26 - 15.09)
Model 4 6 months later1.01.23 (0.74 - 2.03)2.93 (1.68 - 5.11)10.01 (4.54 - 22.07)
Model 5 6 months later1.01.31 (0.76 - 2.26)2.52 (1.39 - 4.57)*9.29 (4.08 - 21.17)
Model 6 6 months later1.01.27 (0.73 - 2.23)2.75 (1.47 - 5.14)*9.10 (3.93 - 21.09)