Journal of Clinical Medicine Research, ISSN 1918-3003 print, 1918-3011 online, Open Access
Article copyright, the authors; Journal compilation copyright, J Clin Med Res and Elmer Press Inc
Journal website http://www.jocmr.org

Review

Volume 6, Number 6, December 2014, pages 399-408


Skeletal Malocclusion: A Developmental Disorder With a Life-Long Morbidity

Figure

Figure 1.
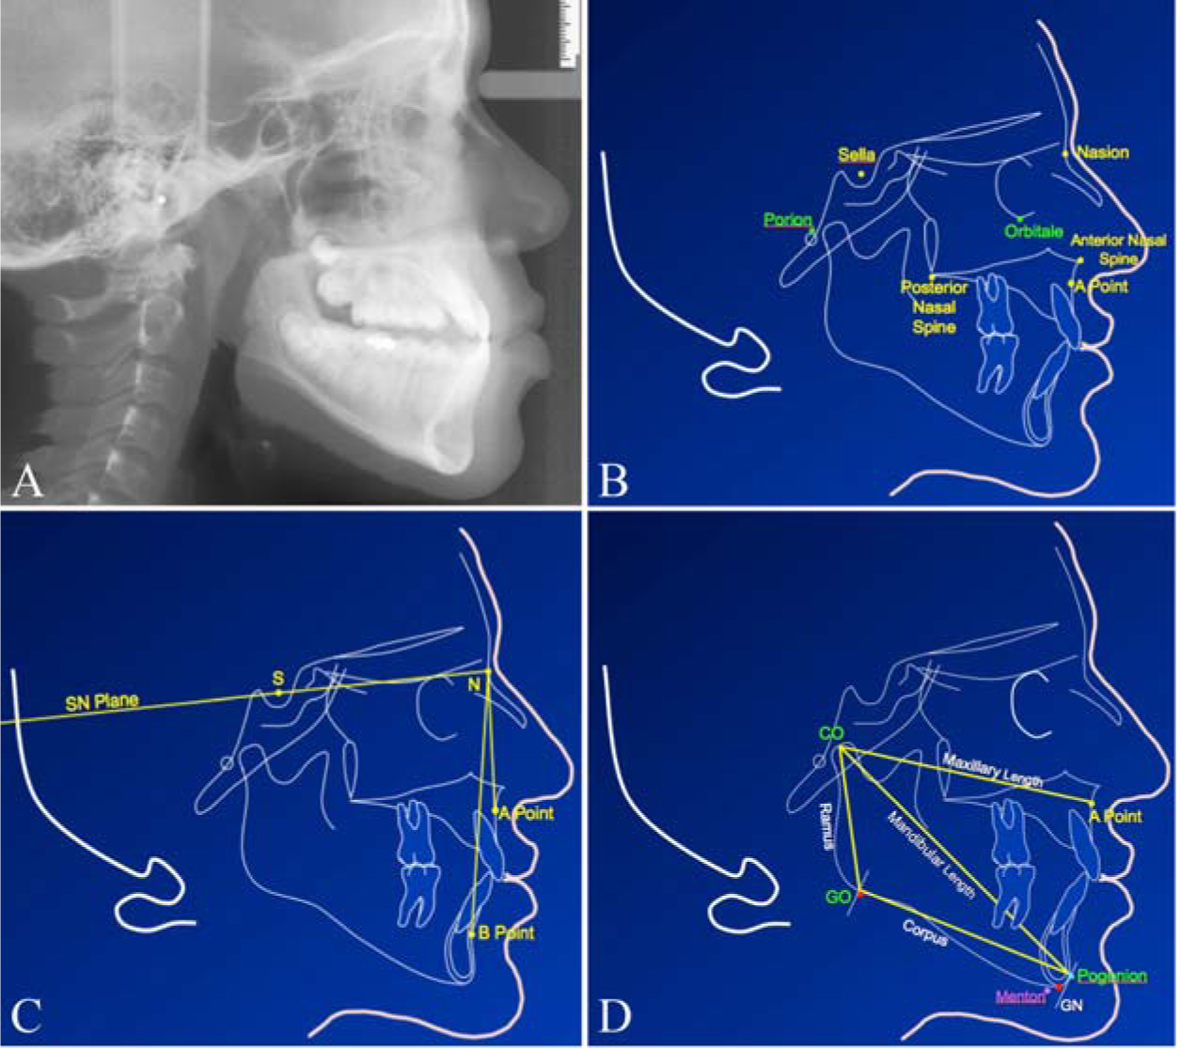
Figure 1. (A) Cephalometric radiograph of a 13-year-old male. (B) Cephalometric tracing of skeletal landmarks used for geometric constructions. (C) The anterior cranial base (S-N plane) and the angle between SNA and SNB planes that indicate the maxillary and mandibular positions, respectively. (D) The mandibular and maxillary landmarks and planes used to measure the length. Co-Pg is the linear mandibular length from condylion to pogonion. Co-Go is the ramus length from the condylion to the gonion. Go-Pg is the mandibular corpus length from the gonion to the pogonion.

Tables

Table 1. Prevalence of Class I, II and III Malocclusion in Different Ethnic Groups
 
Author, yearEthnicitiesSample sizeClass I (a + b)** (%)Class II (a + b)*** (%)Class III (%)
**Class I (a + b) = class I neutrocclusion + class I malocclusion. ***Class II (a + b) = class II Div I + class II Div II.
Angle, 1907Caucasians [17]1,0006919 + 43.40
Altemus, 1959Black American [18]3,28083125
Cohen, 1970Blacks/Whites [19]410/34971/53.611.4/33.66.3/4.7
Garner, 1985Black American [16]44727 + 44168.70
Garner, 1985Kenyan [16]47116.8 + 51.77.90 + 016.80
Phaphe, 2012Urban Indian [20]1,0001830.11.60
Steigman, 1983Israeli Arab [21]803858.5 + 1.71.3
Silva, 2001Latino [22]50762.9 + 6.521.59.1
Lew, 1993Chinese [23]1,0507.1 + 58.821.512.6
Garbin, 2010Brazilian [24]73455.9242.861.22
Hamdan, 2001Jordanian [25]32062.521.516
Average68.720.97.2


Table 2. Percentages of Class I, Class II and Class III Cases With Skeletal Malocclusion Patients Across Sex and Race
 
Class I (n = 11)Class II (n = 79)Class III (n = 81)
Sex
 Male5.80%36.20%58%
 Female6.90%52.90%40.20%
Race
 Caucasian6.30%48.10%45.60%
 Black10%20%70%


Table 3. The Frequencies of Various Occlusion/Malocclusion Categories in US Population Under Different Levels of TPI Scales
 
TPI scaleCategoryFrequency (%)
0Normal occlusion24.4
1 - 3Minor manifestations and treatment need is slight39.0
4 - 6Definite malocclusion but treatment elective8.7
7 - 9Severe handicap, treatment highly desirable22.4
10Very severe handicap with treatment mandatory5.5


Table 4. Association Between Malocclusion and Different Medical Conditions for 3,019 Orthodontic (Malocclusion) Patients From the BigMouth Dental Data Repository [67]
 
Medical conditions (variable)Chi-square valueP value
**Statistical significance.
Sleep apnea0.77280.379
GI disorders12.76490.000**
Lymphoma2.63260.105
General dental problems0.01690.896
Loose broken or missing filling2.29850.129
Bruxism0.26800.605
Cleft lip and palate0.82720.363
Hypertension26.87610.000**
Headache311.10250.000**
Vision problems2.96140.085
Functional pain/discomfort of oral cavity318.24180.000**
Active tuberculosis91.64270.000**