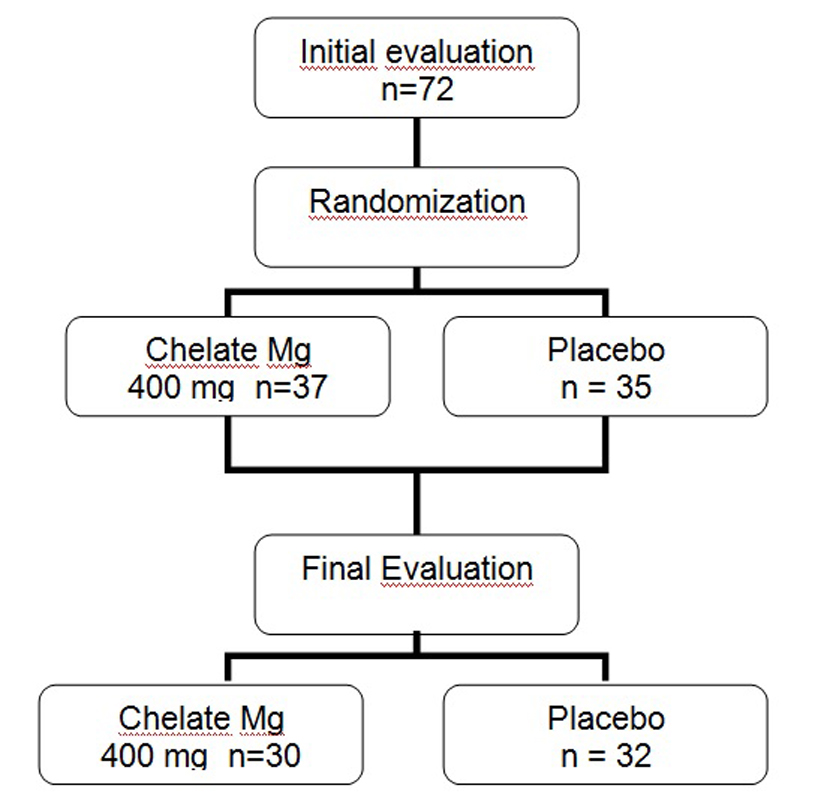
Figure 1. Study design.
| Journal of Clinical Medicine Research, ISSN 1918-3003 print, 1918-3011 online, Open Access |
| Article copyright, the authors; Journal compilation copyright, J Clin Med Res and Elmer Press Inc |
| Journal website http://www.jocmr.org |
Original Article
Volume 6, Number 6, December 2014, pages 456-462
Magnesium Replacement Does Not Improve Insulin Resistance in Patients With Metabolic Syndrome: A 12-Week Randomized Double-Blind Study
Figure
Tables
| Placebo (n = 37) | Magnesium (n = 35) | |
|---|---|---|
| At baseline, there were no differences for any parameters between groups. | ||
| Age (years) | 46.6 ± 12.3 | 44.6 ± 9.7 |
| BMI (kg/m2) | 35.1 ± 6.3 | 35.5 ± 8.2 |
| Waist (cm) | 107.5 ± 12.5 | < 80 |
| Systolic blood pressure (mm Hg) | 134 ± 17 | 134 ± 15 |
| Diastolic blood pressure (mm Hg) | 86 ± 10 | 85 ± 8 |
| Glycemia (mg/dL) | 99 ± 10 | 103 ± 15 |
| HOMA-IR | 3.31 ± 1.86 | 3.41 ± 2.03 |
| Insulin (mU/L) | 13.4 ± 6.4 | 14.5 ± 7.6 |
| Cholesterol (mg/dL) | 190 ± 46 | 203 ± 46 |
| Triglycerides (mg/dL) | 137 ± 61 | 136 ± 54 |
| HDL-c (mg/dL) | 43 ± 10 | 46 ± 10 |
| LDL-c (mg/dL) | 120 ± 39 | 129 ± 43 |
| GGT (mg/dL) | 44 ± 51 | 32 ± 19 |
| PCR (mg/L) | 6.7 ± 7.0 | 5.8 ± 5.3 |
| SMg (mg/dL) | 1.80 ± 0.22 | 1.79 ± 0.15 |
| MMg (µg/mg) | 0.89 ± 0.43 | 0.90 ± 0.40 |
| Magnesium group (n = 30) | Placebo group (n = 32) | |||||
|---|---|---|---|---|---|---|
| Before treatment | After treatment | P value | Before treatment | After treatment | P value | |
| Weight (kg) | 84.6 ± 17.2 | 82.6 ± 17.7 | 0.001 | 89.1 ± 18.6 | 86.2 ± 19.6 | 0.018 |
| BMI (kg/m2) | 33.7 ± 6.7 | 32.8 ± 6.9 | 0.001 | 34.9 ± 6.1 | 34.2 ± 6.1 | 0.020 |
| Waist (cm) | 104 ± 12 | 101 ± 10 | 0.001 | 108 ± 12 | 106 ± 12 | 0.001 |
| Systolic blood pressure (mm Hg) | 134 ± 12 | 124 ± 27 | 0.004 | 132 ± 17 | 128 ± 19 | 0.293 |
| Diastolic blood pressure (mm Hg) | 86 ± 7.6 | 82.9 ± 8.9 | 0.452 | 85 ± 10 | 83 ± 13 | 0.454 |
| Glycemia | 104 ± 16 | 102 ± 12 | 0.091 | 99 ± 11 | 100 ± 10 | 0.545 |
| Insulin (mU/L) | 12.3 ± 7.0 | 10.7 ± 6.3 | 0.240 | 14.4 ± 6.2 | 12.6 ± 6.5 | 0.134 |
| HOMA-IR | 3.2 ± 2.0 | 2.8 ± 1.9 | 0.368 | 3.6 ± 1.9 | 3.2 ± 1.8 | 0.337 |
| Cholesterol (mg/dL) | 204 ± 46 | 208 ± 38 | 0.471 | 192 ± 47 | 191 ± 42 | 0.940 |
| HDL-c (mg/dL) | 46.5 ± 9.0 | 46.3 ± 10.8 | 0.857 | 41.9 ± 10.2 | 41.4 ± 8.5 | 0.722 |
| LDL-c (mg/dL) | 127 ± 42 | 139 ± 38 | 0.238 | 120 ± 41 | 127 ± 41 | 0.173 |
| Triglycerides (mg/dL) | 127 ± 43 | 131 ± 41 | 0.579 | 144 ± 64 | 136 ± 73 | 0.431 |
| Uric acid (mg/dL) | 4.9 ± 1.0 | 4.9 ± 1.1 | 0.945 | 5.6 ± 1.5 | 5.5 ± 1.8 | 0.448 |
| PCR (mg/L) | 6.0 ± 5.3 | 6.1 ± 6.5 | 0.991 | 6.3 ± 7.9 | 5.3 ± 3.3 | 0.463 |
| SMg (mg/dL) | 1.82 ± 0.14 | 1.81 ± 0.16 | 0.877 | 1.87 ± 0.18 | 1.75 ± 0.21 | 0.073 |
| MMg (µg/mg) | 0.90 ± 0.40 | 1.21 ± 0.73 | 0.089 | 0.88 ± 0.37 | 0.86 ± 0.23 | 0.920 |
| Magnesium | Placebo | P | |
|---|---|---|---|
| Δ: means change from baseline to end point between the beginning and the end of study; SBP: systolic blood pressure; DBP: diastolic blood pressure. | |||
| Δ SBP (mm Hg) | -8.5 ± 27.8 | -4.0 ± 19.7 | 0.498 |
| Δ DBP (mm Hg) | -2.0 ± 9.3 | -1.9 ± 13 | 0.964 |
| Δ Fast blood glucose (mg/dL) | -2.0 ± 6.2 | +0.9 ± 8.3 | 0.129 |
| Δ Insulin | -1.7 ± 6.4 | -1.6 ± 7.2 | 0.938 |
| Δ HOMA-IR | -0.36 ± 2.10 | -0.32 ± 1.80 | 0.928 |
| Δ Triglycerides (mg/dL) | +3.6 ± 35 | -8.1 ± 55.3 | 0.337 |
| Δ HDL (mg/dL) | -0.17 ± 5.1 | -0.50 ± 7.6 | 0.847 |