Journal of Clinical Medicine Research, ISSN 1918-3003 print, 1918-3011 online, Open Access
Article copyright, the authors; Journal compilation copyright, J Clin Med Res and Elmer Press Inc
Journal website http://www.jocmr.org

Original Article

Volume 5, Number 2, April 2013, pages 101-111


The Use of GDS-15 in Detecting MDD: A Comparison Between Residents in a Thai Long-Term Care Home and Geriatric Outpatients

Figure

Figure 1.
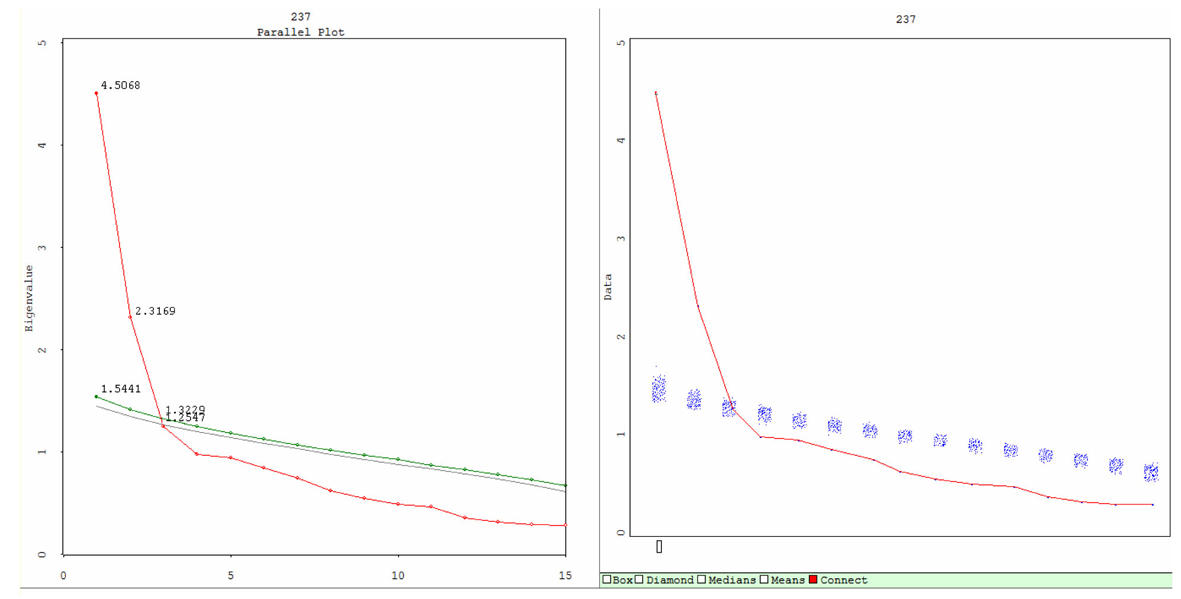
Figure 1. The plots of Scree Parallel (Left) and Scree Simulation (right) from parallel analysis. The Scree Parallel plot graphs the observed and estimated eigenvalues. Red indicates observed eigenvalues (4.5068 for Factor I and 2.3169 for Factor II), green indicates 95th percentile random data eigenvalues, and gray indicates mean of the random data eigenvalues. The lines intersect denotes the number of factors that must be retained according to the parallel analysis criterion. The lines cross at the second principal component. The Left graph is a summary of the Right, which provides greater detail on the simulation process. The Scree simulation plot demonstrates the Scree plot of the observed eigenvalues and all the Scree plots resulting from the simulated data (shown as a blue stripe). In this dataset, Factor I and Factor II are retained, factor III onwards have Eigen values less than that from simulations, and are therefore rejected.

Tables

Table 1. Clinical Characteristics of the Sample
 
Outpatients’ group
(n = 156)
LTC group
(n = 81)
All
(n = 237)
StatisticP-value
*Fisher Exact; †diagnosis made by MINI; LTC: long-term care facility; SD: standard deviation; TGDS: Thai version of Geriatric Depression Scale; MMSE: Mini-Mental State Examination.
Age, Mean ± SD68.83 ± 6.0476.50 ± 7.2871.45 ± 7.43t = 8.61< 0.0001
Gender, %female106 (67.9)45 (55.6)151 (63.7)0.021*
Marital Status: living with spouse, n (%)79 (50.6)6 (7.1)35 (14.8)< 0.0001*
Education (years, Mean ± SD)3.30 ± 3.333.52 ± 3.563.46 ± 3.37t = 0.4650.643
MDD†, n (%)68 (43.6)23 (28.4)91 (38.4)0.088*
MDD: %Male:%female12.2:34.110:1911.4:27.0
Cognitively impaired by MMSE, n (%)0 (0)28 (34.6)-
MMSE, Mean ± SD (Min-Max)23.96 ± 4.76 (10 - 36)18.18 ± 6.98 (3 - 36)23.46 ± 4.81 (10 - 36)t = 7.53< 0.0001
TGDS-15, Mean ± SD5.27 ± 3.788.59 ± 2.806.41 ± 3.82t = 6.43< 0.0001


Table 2. GDS-15 Outcomes for the Outpatients’ Clinic and LTC Home Among Samples Without Cognitive Impairment
 
SettingNAlphaAUC95% Confidence IntervalCut-offSensitivitySpecificityYouden’s Index
Lower BoundUpper Bound
LTC: long term care facility; AUC: area under curve; *The best cut-off score as suggested by Youden’s index.
Outpatients’ Clinic1560.840.960.930.98≥ 495750.70
≥ 5*92870.80
≥ 686910.77
LTC home530.70.820.690.94≥ 8*100490.49
≥ 980650.45
≥ 1060840.44
All cases2090.820.880.830.92≥ 693630.57
≥ 7*88750.63
≥ 879810.59


Table 3. Exploratory Factor Analysis Using TGDS-15: Two-Factor Solution (n = 209)
 
Item no.TGDS itemh2Factor IFactor II
h2: communality loading coefficient less than 0.1 are not shown; TGDS: Thai version of Geriatric Depression Scale.
14Feel that situation is hopeless0.6890.8280.184
8Feel helpless0.6750.8210.164
12Feel pretty worthless0.6930.8170.284
4Often get bored0.5560.7450.134
3Feel that life is empty0.4590.6610.250
6Afraid something bad is going to happen0.4170.621
2Have dropped many activities and interests0.3010.5470.123
10More problems with memory than most0.1950.4320.160
15Feel that most people are better off than me0.0450.184
11Think it is (not) wonderful to be alive0.5570.1830.743
7Feel (not) happy most of the time0.620.3870.738
5(Not) in good spirits most of the time0.5570.718
1Basically (not) satisfied with my life0.5120.699
13Feel (not) full of energy0.4680.2440.669
9Prefer staying home to going out0.240.3040.428
Eigenvalue4.6232.360
Cumulated total explained, %30.8215.73
Cronbach’s alpha, overall = 0.820.820.76


Table 4. Differential Item Functioning: Odds Ratios for GDS-15 Items Across Categories for Gender, Education and Age
 
GenderEducationAge
uniformnon-uniformuniformnon-uniformuniformnon-uniform
ItemORγ2dfSig.ORγ2dfSig.ORγ2dfSig.ORγ2dfSig.ORγ2dfSig.ORγ2dfSig.
Bold figures: Statistically significant, meets DIF criteria; OR: Odds Ratio; γ2: Wald Statistic; Df: Degrees of freedom; Sig: Significance level.
11.52835.22920.2140.96935.34330.7380.91634.00320.6581.01534.07330.7912.2137.43520.0181.08238.03630.446
20.41862.25420.0181.03962.38230.7191.26657.44920.2591.03357.71630.6060.56255.94120.1030.8359.0730.071
30.39193.1820.6990.95593.2830.7541.11892.6820.6441.03592.83730.6921.18790.08220.6611.02390.10330.885
41.05993.61120.8861.10294.19530.441.33295.31620.2270.93396.03530.4010.496.0920.0230.88596.81130.384
50.84829.66820.6130.93230.2930.4361.10929.55520.5910.93131.24430.1981.87430.76920.0551.06531.19130.521
61.55851.7620.2160.93452.19530.5161.57354.65120.0360.99854.65330.970.33659.4620.0040.98659.47430.907
71.086103.00720.841.066103.23130.6331.026102.61920.9150.93103.35130.3971.511100.17220.2960.991100.17630.949
83.198127.32120.0350.967127.33830.8980.985122.76120.9571.006122.76230.9661.014120.64920.9760.808121.52930.335
90.77354.53720.4761.00254.53830.9830.78855.60920.2560.97555.76930.690.7154.26820.3440.99754.26830.982
101.47949.85820.2570.79354.5430.0451.01348.78220.9481.00848.830.8910.92548.46820.820.94548.46830.585
110.64664.5120.240.90465.29530.3860.80564.0120.3211.02364.1230.7412.09764.79620.041.33369.11730.061
121.104157.54220.8641.471158.99430.2130.812158.30620.5280.761159.94930.2021.183155.71620.7450.743156.51130.362
130.80166.6420.5420.91267.30830.4240.98766.52920.9521.05967.28930.3851.55864.89620.2150.82568.03730.071
145.16966.6420.011.24267.30830.4830.66140.37320.1940.793141.91130.2160.581137.78120.2821.83139.79530.23
150.9679.33620.9220.999.34930.9070.9829.41220.9291.0169.49530.7730.9988.49520.9951.14610.27630.196