Journal of Clinical Medicine Research, ISSN 1918-3003 print, 1918-3011 online, Open Access
Article copyright, the authors; Journal compilation copyright, J Clin Med Res and Elmer Press Inc
Journal website http://www.jocmr.org

Original Article

Volume 5, Number 2, April 2013, pages 75-83


Geriatric Trauma Patients With Cervical Spine Fractures due to Ground Level Fall: Five Years Experience in a Level One Trauma Center

Figure

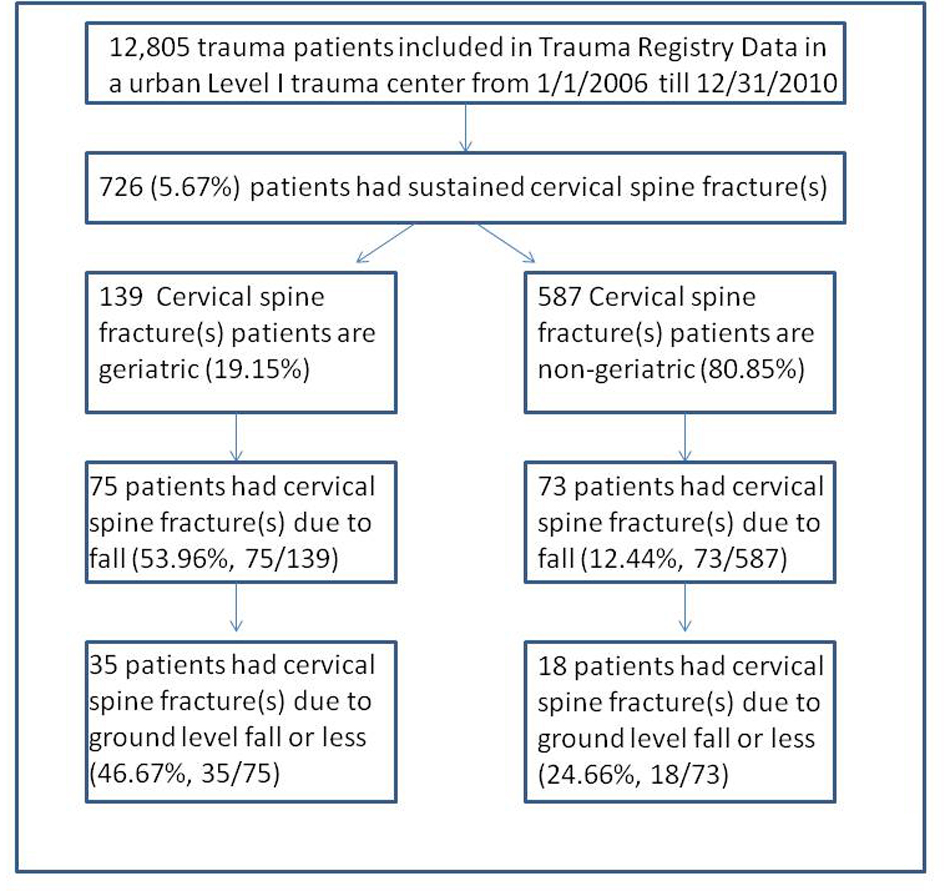
Figure 1.
Figure 1. Flow diagram of trauma patients with cervical spine fractures. Among all trauma patients, 5.67% (726/12,805) patients had sustained C-spine fracture(s) and 19.15% (139/726) of C-spine fracture patients were geriatric. Furthermore, approximately half of these geriatric patients obtained C-spine fractures due to fall.

Tables

Table 1. Clinical Characteristics of Trauma Patients With Cervical Spine Fractures
 
Geriatric Trauma Patients
n = 139
Non-geriatric Trauma Patients
n = 587
P
SD: standard deviation; MVC: motor vehicle collision; * Others: including E-code 805.2 (pedestrian hit by rolling stock), 807.8 (railway accident of unspecified nature injuring other specified person), 826.1 (pedal cycle accident), 910.9 (accidental drown/submersion), 916.0 (struck accident by falling objects), 918.0 (caught accidentally in or between objects), 919.2 (machinery accident), 925.2 (accident electric current - industrial wires/appliance/machinery), and 958.8 (suicidal/self injury-hanging), etc. Basic characteristics of trauma patients with C-spine fractures. Geriatric trauma patients tended to have male in predominance (P < 0.001), sustain more C-spine injuries due to fall, whereas in non-geriatric patients C-spine injuries mainly occurred from MVC (P < 0.001).
Age (Mean ± SD)78.02 ± 8.5237.15 ± 13.69< 0.001
(95%CI 76.59 - 79.45)(95%CI 36.04 - 38.26)
Gender (% Male)56.83% (79/139)74.11% (435/587)< 0.001
Mechanism
  MVC40.29% (56/139)79.56% (467/587)
  Fall53.96% (75/139)12.44% (73/587)
  Assault1.44% (2/139)2.39% (14/587)
  Others*4.32%(6/139)5.62% (33/139)< 0.001


Table 2. Type and Distribution of C-Spine Fractures in Trauma Patients
 
Location of C-spine FracturesTrauma Patients with C-spine FractureTrauma Patient with C-spine Fracture due to GLF
Geriatric Trauma PatientsNon-geriatric Trauma PatientsPGeriatric Trauma PatientsNon-geriatric Trauma PatientsP
n = 139n = 587n = 35n = 18
Different type and distribution of C-spine fractures in trauma patients. Among all trauma patients with C-spine fractures, geriatric patients tended to sustain more C1 and C2 fractures than non-geriatric patients (P < 0.001), whereas non-geriatric patients tended to sustain more C6 and C7 fractures (P < 0.001). Similar results showed on patients with C-spine fracture due to GLF with more non-geriatric patients sustained single C-spine fracture.
C138 (27.34%)80 (13.63%)< 0.00116 (45.71%)5 (27.78%)0.206
C275 (53.96%)129 (21.98%)< 0.00120 (57.14%)3 (16.67%)0.005
C311 (7.91%)47 (8.01%)0.9714 (11.43%)3 (16.67%)0.594
C418 (12.95%)78 (13.29%)0.9166 (17.14%)6 (33.33%)0.182
C515 (10.79%)110 (18.74%)0.0264 (11.43%)5 (27.78%)0.133
C619 (13.67%)188 (32.03%)< 0.0012 (5.71%)2 (11.11%)0.481
C726 (18.71%)243 (41.40%)< 0.0012 (5.71%)0 (0%)0.301
Single C-spine fracture94 (67.63%)378 (64.40%)0.47319 (54.29%)15 (83.33%)0.037


Table 3. Associated Injuries With C-Spine Fractures in Trauma Patients due to GLF or Less
 
Geriatric PatientsNon-geriatric PatientsP
(n = 35)(n = 18)
ICP: intracranial pathology; GCS: Glasgow Coma Scale; GLF: ground level fall; SD: standard deviation; CI: confidence interval; Upper C-spine fractures: C1, C2 spine fractures. The associated injuries with C-spine fractures in trauma patients due to GLF. Geriatric patients with C-spine fractures tended to occur more in female, sustained more fractures in upper C-spine, and co-existed more with ICP than non-geriatric patients (P < 0.05). The occurrence of other injuries showed no significant difference (P > 0.05).
Gender (Male)13 (37.14%)14 (77.78%)0.005
Upper C-spine fractures26 (74.29%)7 (38.89%)0.012
ICP7 (20%)00.042
Clavicle fractures01 (5.56%)0.159
Facial/skull fractures3 (8.57%)4 (22.22%)0.165
GCS (mean ± SD, 95%CI)14.4 ± 1.8 (13.8 - 15.1)14 ± 2.2 (12.8 - 15.1)0.450
Rib fractures1 (2.86%)00.469
Hip/femur fractures2 (5.71%)2 (11.11%)0.481
Facial laceration/abrasion14 (40%)7 (38.89%)0.938


Table 4. Intracranial Pathology (ICP) and C-Spine Fractures in Trauma Patients due to GLF
 
Geriatric Trauma Patients due to GLF (n = 504)Non-geriatric Trauma Patients due to GLF (n = 1,128)P
The occurrence of ICP and C-spine fracture in trauma patients due to GLF. It indicated that geriatric trauma patients tended to sustain not only C-spine fractures but also ICP as well. Additionally, only ICP and C-spine fracture co-existed in geriatric trauma patients due to GLF in this study (P < 0.001).
C-spine fractures35 (6.94%)18 (1.59%)< 0.001
ICP32 (6.34%)36 (3.19%)0.0049
C-spine fracture and ICP7 (1.38%)0 (0%)< 0.001


Table 5. Logistic Regression Analysis of Risk Factors of Head Injury in Trauma Patients With C-Spine Fractures due to GLF
 
Risk FactorsAdjusted Odds RatioP95% Confidence Interval
Upper C-spine fractures including C1 and C2 fractures, GCS: Glasgow Coma Scale, Facial fractures including skull fractures. The results of logistic regression analysis. Potential risk factors that could predict the co-injury patterns of C-spine fracture and intracranial pathology in trauma patients were analyzed and adjusted odds ratios were showed. Two clinical variables (age and male gender) were considered independent risk factors to predict this co-injury pattern in trauma patients.
Upper C-spine fractures0.040.0760.00 - 1.39
GCS0.730.3600.38 - 1.41
Age1.170.0311.01 - 1.35
Gender (male)91.570.0381.29 - 6,472.43
Facial Laceration/abrasion0.100.2190.00 - 3.90
Facial Fractures0.450.6390.01 - 12.29
Femur Fractures3.170.5040.10 - 94.40


Table 6. List of C-Spine Trauma Patients With Intracranial Pathology due to GLF
 
AgeGenderICPC-spine FracturesGCSOther injuries
ICP: intracranial pathology; SDH: subdural hemorrhage; SAH: subarachnoid hemorrhage; EDH: epidural hemorrhage; GCS: Glasgow coma scale. The list of all C-spine fracture patients with associated ICP. All patients sustained C-spine fractures due to GLF. Their mean ages were 81.85 ± 9.33 and 85.7% (6/7) were male. None of these patients had GCS < 14.
165MaleSDH, SAHC514N/A
279MaleSDH, SAHC214Femur Fracture
393MaleEDHC115N/A
486MaleSDHC315Facial laceration/abrasion
576MaleSDHC715Facial Fractures
688FemaleSDHC214Facial laceration/abrasion
786MaleSAHC414N/A


Table 7. The Role of Alcohol in C-Spine Fracture Trauma Patients due to GLF
 
Blood Alcohol Level (mg/dL)Geriatric Trauma PatientNon-geriatric Trauma Patient
n = 31n = 17
*Not including 200 mg/dL. P < 0.001. The results of blood alcohol level (BAL) in trauma patients due to GLF. Only 48 patients had BAL recorded in trauma registry data. From these 48 patients, only one patient from geriatric group had toxic BAL, whereas over 50% of non-geriatric trauma patients had elevated BAL (P < 0.001).
< 80 mg/dL308
80 - 200 mg/dL*12
≥ 200 mg/dL07