Journal of Clinical Medicine Research, ISSN 1918-3003 print, 1918-3011 online, Open Access
Article copyright, the authors; Journal compilation copyright, J Clin Med Res and Elmer Press Inc
Journal website http://www.jocmr.org

Original Article

Volume 05, Number 3, June 2013, pages 205-216


The Effect of Whole Body Vibration Exposure on Muscle Function in Children With Cystic Fibrosis: A Pilot Efficacy Trial

Figures

Figure 1.
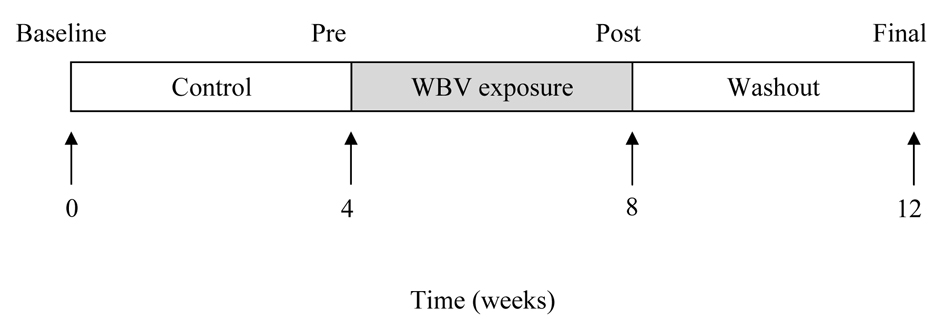
Figure 1. Study Design. The arrows indicate 4 test occasions over the twelve weeks. Baseline values were obtained at week 0, at end of Control period testing at week 4, at end of Vibration exposure period at week 8, and at end of Washout period between week 8 and at week 12. The black rectangle indicates the training weeks, and the white rectangle shows when there was no applied intervention. Usual care was given throughout the twelve weeks. In the Control and Washout periods, participants continued usual physical activity.
Figure 2.
Figure 2. Flow diagram of participant recruitment.

Tables

Table 1. Training Volume and Training Intensity of the Whole Body Vibration (WBV) Program
 
WeekTraining frequency (days/week)Vibration frequency (Hz)Peak-to-Peak Vibration amplitude (mm)Vibration magnitude (g)*Total session duration (mins)Vibration exposure (mins)
* Formula for vibration magnitude [40]: g = A (2πf)2/9.81, A: Peak-to-Peak Vibration amplitude (mm); f: frequency (Hz); 9.81 = force due to gravity.
532011.612010
632011.613015
732211.953015
832211.953015


Table 2. Participant Characteristics
 
CharacteristicBaseline (n = 7)
Values are mean ± standard deviations (SD); cm = centimetre; ml = millimetres; min = minute; kg = kilogram; cm = centimetre; m = metre; N = Newtons; Nm, Newton-metres; W = watts; % pred = value reported as percent of predicted value, 1RM = one repetition maximum; CFQ-R = cystic fibrosis questionnaire revised, where higher scores indicate better quality of life [10]; FEV1 = forced expiratory volume in 1 second; FVC = forced vital capacity; VC = vital capacity; RV = residual volume; TLC = total lung capacity; VO2peak = peak oxygen uptake during volitional maximum treadmill test; OUES = oxygen uptake efficiency slope; higher OUES is associated with higher aerobic capacity [31].
Age11.7 ± 2.6
Sex60% girls
Anthropometry
  Height (cm)146.2 ± 17.7
  Weight (kg)40.8 ± 16.3
  BMI (kg/m2)18.3 ± 3.0
  Waist circumference (cm)67.5 ± 8.3
Health-Related Quality of Life
Total score on CFQ-R (%) [12] (0 - 100)83.5
Respiratory function (% of predicted)
  FEV177.4 ± 14.4
  FVC88.0 ± 16.4
  VC93.2 ± 13.6
  RV125.3 ± 92.8
  TLC99.7 ± 16.0
Aerobic Capacity
  VO2 peak (ml/kg/min)34.5 ± 5.1
  OUES [31]706.4 ± 281.7
Physical Performance
  Countermovement jump height (cm)27.0 ± 5.0
  Countermovement jump power (W)652.0 ± 306.0
  Leg Extension strength (Nm)86 ± 37
  Chest Press strength (N)213 ± 82
  Leg Press strength (N)816 ± 168
  Leg Extension peak power (W)199 ± 103
  Chest Press peak power (W)138 ± 66
  Leg Press peak power (W)473 ± 247


Table 3. Outcome Variables at Four Measurement Time Points
 
Outcome variableBaselinePre WBVPost WBVFinalP value†Effect Size 95% CI(lower, upper)Post vs Final P value‡
Values are mean ± standard deviations; Participants (WBV = 6); Effect sizes (ES) [32] were calculated as: Post testmean-pre testmean/pre SD for each of the time periods; CI = confidence interval; cm = centimetre; kg = kilogram; BMI = body mass index (kg/m2); Nm = Newton metres; N = Newtons; W = Watts; ml = millimetres; CP = chest press; LE = leg extension; LP = leg press;VO2peak = maximum oxygen uptake; OUES = oxygen uptake efficiency slope, higher values associated with higher aerobic capacity [31]; FEV1 = forced expiratory volume in 1 second; FVC = forced vital capacity; FEF25-75% = forced mid-expiratory flow rate; Higher OUES = higher aerobic capacity; CFQ-R = Cystic Fibrosis Questionnaire-Revised, a disease-specific health-related quality of life questionnaire; higher values reflect better quality of life [10]. Normalised values are calculated as absolute strength or power/body weight in kg. *P < 0.05; † Repeated Measures ANOVA of baseline, pre, post timepoints only; ‡ paired t test to compare post and final timepoint.
Muscle Strength
  LE strength(Nm)80.2 ± 3780.2 ± 48.297.0 ± 6692.7 ± 58.40.160.27 (-0.87, 1.41)0.46
  LE relative strength (Nm/kg)2.0 ± 0.31.88 ± 0.42.2 ± 0.52.1 ± 0.40.140.66 (-0.50, 1.82)0.51
  CP strength (N)201.0 ± 82.9199.0 ± 86222.3 ± 109.3220.3 ± 104.90.060.22 (-0.92, 1.35)0.81
  CP relative strength (N/kg)5.1 ± 0.64.90 ± 0.65.3 ± 0.35.3 ± 0.50.100.92 (-0.27, 2.11)0.79
  LP strength (N)831.2 ± 197.5838.0 ± 212.7938.8 ± 320.4908 ± 331.20.300.33 (-0.91, 1.58)0.56
  LP relative strength (N/kg)21.3 ± 5.621.0 ± 4.922.9 ± 4.922.1 ± 5.10.400.36 (-0.89, 1.61)0.49
Muscle Power
  LE peak power (W)189.7 ± 108.7196.7 ± 124.1222.7 ± 162.2220.3 ± 174.40.150.17 (-0.97, 1.30)0.82
  LE relative peak power (W/kg)4.5 ± 0.84.5 ± 0.94.9 ± 1.45.0 ± 1.10.140.33 (-0.81, 1.47)0.93
  CP peak power (W)132.0 ± 70.4132.3 ± 69.1133.3 ± 65.4137.5 ± 74.10.520.01 (-1.12, 1.15)0.53
  CP relative peak power (W/kg)3.2 ± 0.63.1 ± 0.63.2 ± 0.73.2 ± 0.50.970.06 (-1.07, 1.19)0.98
  LP peak power (W)470.6 ± 288.7469.2 ± 224.8523.6 ± 251.4519.6 ± 3320.590.21 (-1.04, 1.45)0.96
  LP relative peak power (W/kg)10.7 ± 2.110.7 ± 1.611.9 ± 1.49.5 ± 4.10.480.78 (-0.50, 2.07)0.26
Counter-movement Jump (CMJ) Performance
  Height (cm)26.3 ± 5.225.2 ± 4.727.8 ± 3.426.3 ± 3.30.110.60 (-0.56, 1.76)0.17
  Peak power (W)634.2 ± 331.8673.4 ± 375.1721.4 ± 425.8715.5 ± 427.30.130.11 (-1.02, 1.24)0.77
  Relative peak power (W/kg)15.4 ± 2.216.1 ± 3.716.8 ± 2.4167.0 ± 2.70.390.19 (-0.95, 1.32)0.86
Peak Aerobic Capacity
  VO2peak (ml/kg/min)32.3 ± 4.138.7 ± 535.6 ± 4.736.6 ± 2.60.16-0.61 (-1.76, 0.55)0.69
  OUES706.4 ± 281.7953.8 ± 280.5866.8 ± 272840.1 ± 331.5< 0.01-0.28 (-1.53, 0.96)0.62
Respiratory function
  FEV1 (%)75 ± 14.180.2 ± 9.578.0 ± 7.5-0.47-0.23 (-1.37, 0.90)-
  FVC (%)85.5 ± 16.591.83 ± 11.089.0 ± 7.6-0.49-0.28 (-1.41, 0.86)-
  FEF25-75%64.7 ± 2468.83 ± 22.266.0 ± 15.8-0.70-0.14 (-1.27, 1.00)-
  CFQ-R84.5 ± 7.383.3 ± 9.081.0 ± 11.5-0.37-0.20 (-1.33, 0.94)-


Table 4. Post-Hoc Power Calculations
 
Main outcomesEffect SizeTotal sample size required (n)
*G-power software (GPower 3.0 for Windows, Germany) used to compute sample size necessary to achieve statistical significance assuming and two-sided alpha of 0.05 and a beta of 0.20. Sample size assumes a 2-group design, with equal 1:1 allocation to each group. Power calculations were performed for the 4 variables with the largest Effect Sizes observed in this pilot study.
LE relative strength (Nm/kg)0.66 (-0.50, 1.82)10
CP relative strength (N/kg)0.92 (-0.27, 2.11)9
LP relative peak power (W/kg)0.78 (-0.50,2.07)12
Counter-movement jumpheight (cm)0.60 (-0.56, 1.76)18