Figure 1. A correlation between body mass index at baseline and change in body weight after the 6-month sitagliptin treatment. A statistical analysis was performed by the Pearson's correlation test. r indicates correlation coefficient.
| Journal of Clinical Medicine Research, ISSN 1918-3003 print, 1918-3011 online, Open Access |
| Article copyright, the authors; Journal compilation copyright, J Clin Med Res and Elmer Press Inc |
| Journal website http://www.jocmr.org |
Original Article
Volume 4, Number 4, August 2012, pages 251-258
Effects of 6-Month Sitagliptin Treatment on Glucose and Lipid Metabolism, Blood Pressure, Body Weight and Renal Function in Type 2 Diabetic Patients: A Chart-Based Analysis
Figure
Tables
| Presented values indicate mean ± S.D., e-GFR, estimated glomerular filtration rate; HDL, high-density lipoprotein; LDL-C, low-density lipoprotein-cholesterol; TG, triglyceride. | |
| Number of subjects | 220 |
| Age (years old) | 64.0 ± 14.0 |
| Sex (male/female) | 102/118 |
| Body height (cm) | 160.0 ± 8.9 |
| Body weight (kg) | 68.2 ± 15.8 |
| Body mass index (kg/m2) | 26.1 ± 5.3 |
| Systolic blood pressure (mmHg) | 126.7 ± 15.5 |
| Diastolic blood pressure (mmHg) | 69.8 ± 13.6 |
| Plasma glucose (mg/dL) | 185.5 ± 69.3 |
| Hemoglobin A1c (%) | 8.1 ± 1.3 |
| Serum LDL-C (mg/dL) | 105.0 ± 28.5 |
| Serum TG (mg/dL) | 176.7 ± 122.0 |
| Serum HDL-C (mg/dL) | 50.7 ± 14.6 |
| e-GFR (mL/min./1.73m2) | 77.4 ± 24.4 |
| No other drugs | 15 |
| Sulfonyl urea | 80 |
| Biguanide | 122 |
| Pioglitazone | 84 |
| α-glucosidase inhibitor | 80 |
| Glinide | 26 |
| Subjects studied (n) | Data after 6 month-use of sitagliptin | Changes compared with data before sitagliptin use | P value | |
|---|---|---|---|---|
| Presented values indicate mean ± S.D. Statistical analyses have been done by Paired t Test. e-GFR, estimated glomerular filtration rate; HDL, high-density lipoprotein; LDL-C, low-density lipoprotein-cholesterol; NS, not statistically significant; TG, triglyceride. | ||||
| Body weight (kg) | 141 | 67.4 ± 15.8 | -0.8 ± 3.7 | < 0.001 |
| Systolic blood pressure (mmHg) | 169 | 125.2 ± 13.6 | -1.5 ± 17.6 | NS |
| Diastolic blood pressure (mmHg) | 169 | 70.6 ± 11.0 | +0.7 ± 12.4 | NS |
| Plasma glucose (mg/dL) | 195 | 175.7 ± 67.1 | -9.8 ± 70.8 | NS |
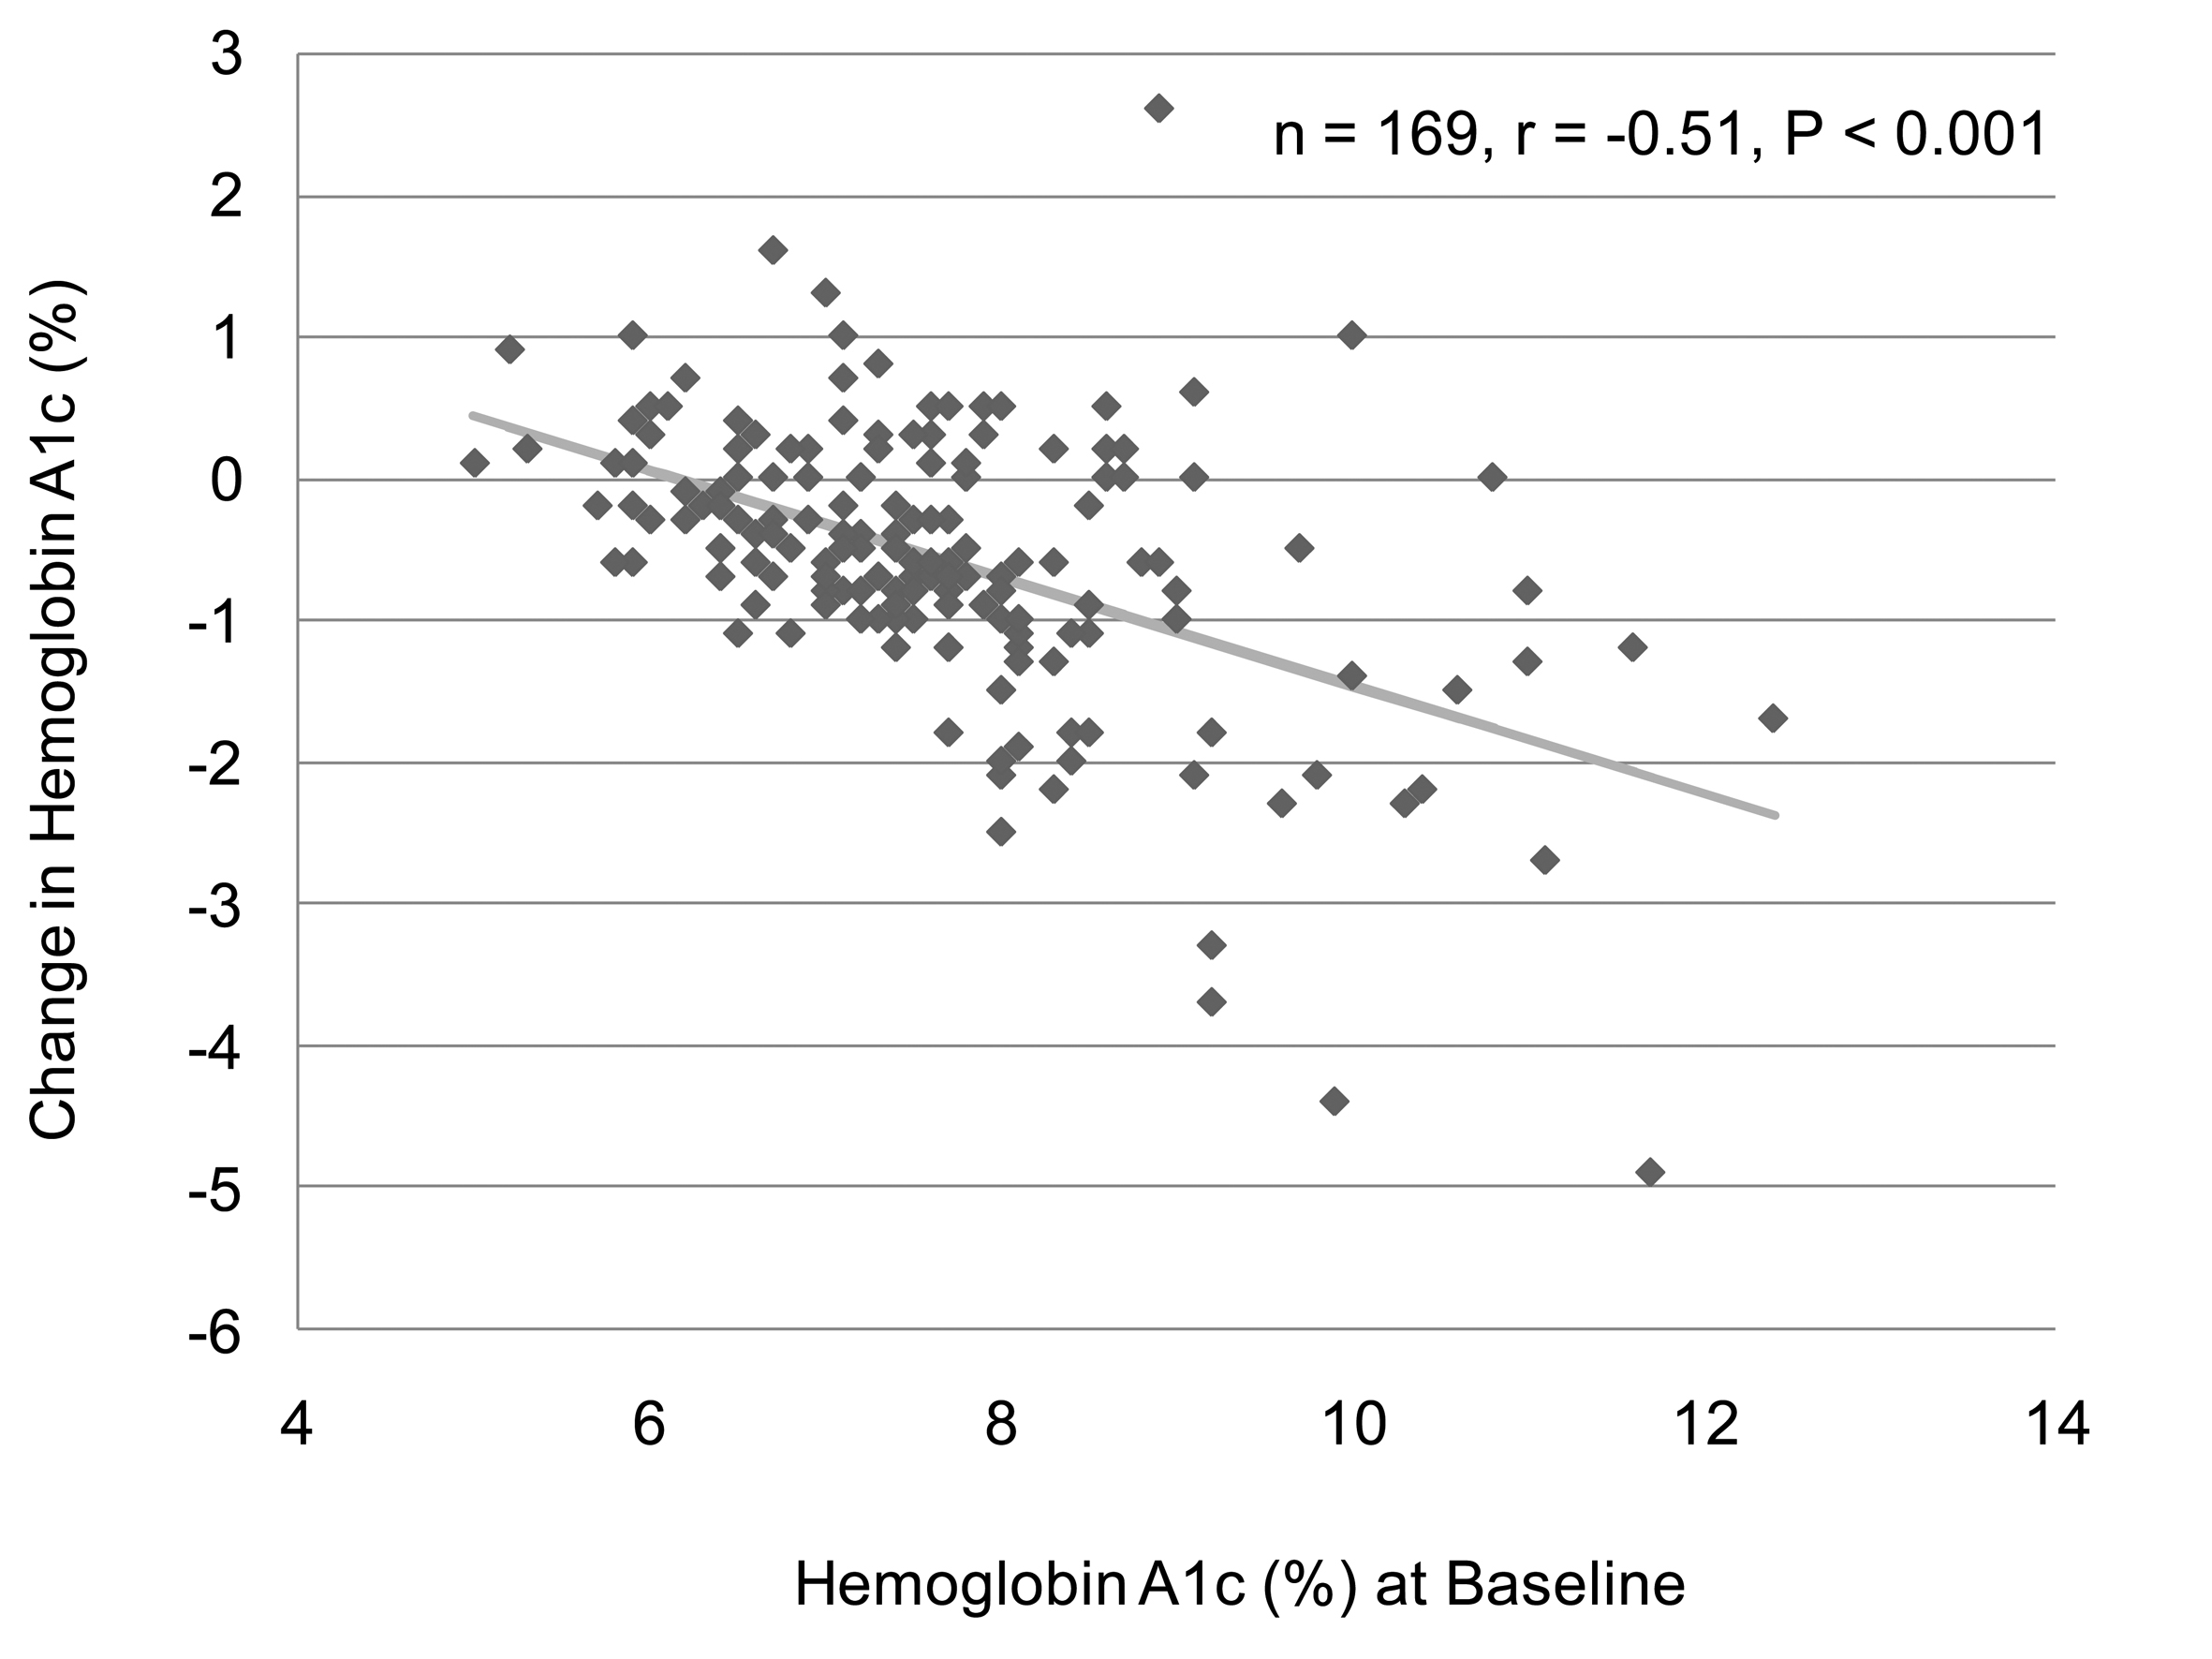
| Hemoglobin A1c (%) | 169 | 7.5 ± 1.2 | -0.6 ± 1.0 | < 0.001 |
| Serum LDL-C (mg/dL) | 161 | 103.5 ± 25.6 | -0.7 ± 27.6 | NS |
| Serum TG (mg/dL) | 161 | 169.4 ± 121.2 | -7.3 ± 115.1 | NS |
| Serum HDL-C (mg/dL) | 161 | 49.8 ± 13.1 | -0.9 ± 8.9 | NS |
| e-GFR (mL/min./1.73m2) | 199 | 75.9 ± 25.4 | -1.5 ± 11.9 | NS |
| Increased | Unchanged | Decreased | |
|---|---|---|---|
| Body weight | 46 (32.6%) | 20 (14.2%) | 75 (53.2%) |
| Hemoglobin A1c | 44 (26.0%) | 9 (5.3%) | 116 (68.6%) |
| Before sitagliptin use (n) | After sitagliptin use (n) | P value | |
|---|---|---|---|
| Statistical analyses have been done by Pearson's chi-squared test. NS, not statistically significant. | |||
| Urinary glucose | |||
| (-) | 95 | 119 | < 0.01 |
| (+/-) | 9 | 10 | NS |
| (1+) | 16 | 8 | NS |
| (2+) | 14 | 8 | NS |
| (3+) | 44 | 33 | NS |
| Urinary protein | |||
| (-) | 104 | 97 | NS |
| (+/-) | 39 | 42 | NS |
| (1+) | 22 | 22 | NS |
| (2+) | 9 | 13 | NS |
| (3+) | 4 | 4 | NS |