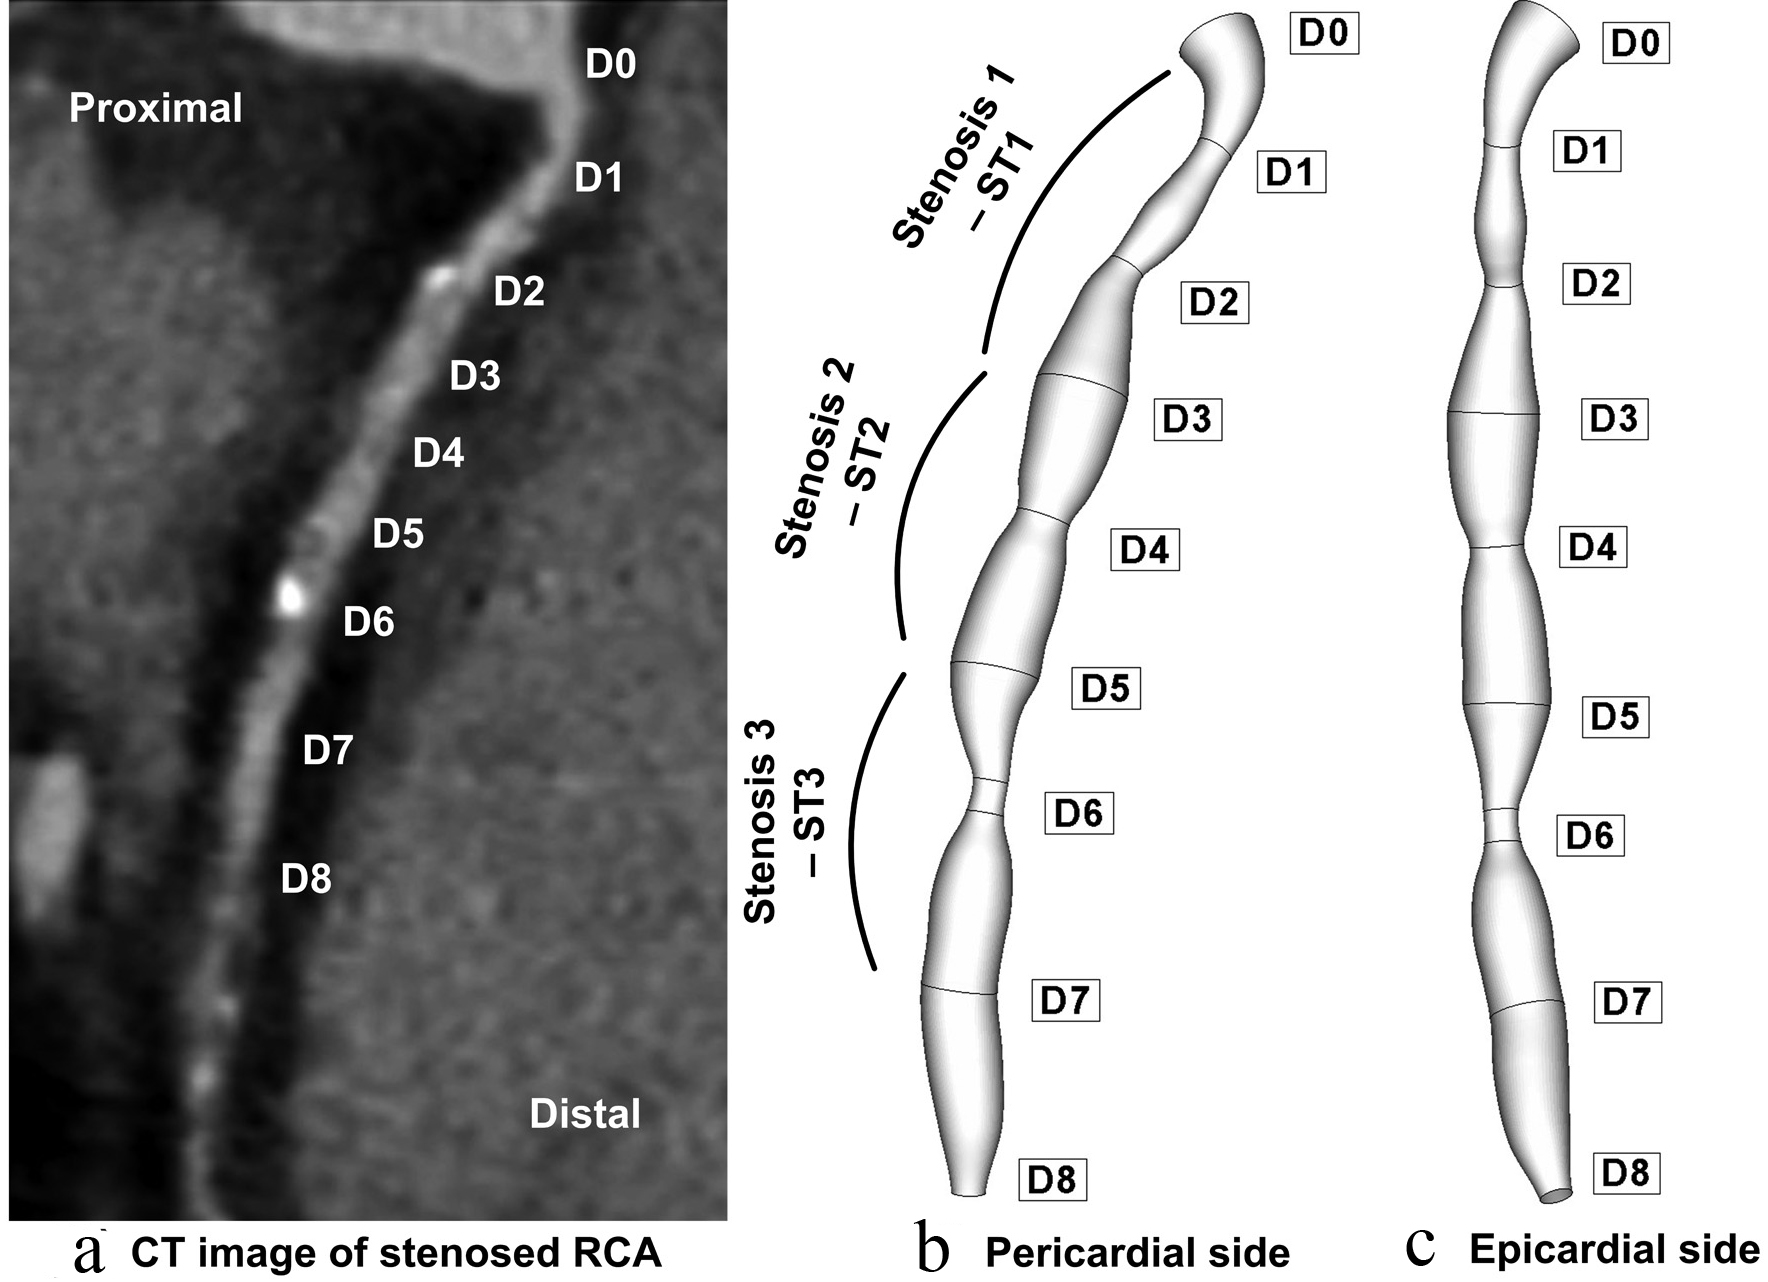
Figure 1. Patient-specific right coronary artery (RCA); (a) axial tomographic image which indicates a multiple coronary stenosis at the right coronary artery; geometry reconstruction (b) pericardial side, (c) epicardial side.
| Journal of Clinical Medicine Research, ISSN 1918-3003 print, 1918-3011 online, Open Access |
| Article copyright, the authors; Journal compilation copyright, J Clin Med Res and Elmer Press Inc |
| Journal website http://www.jocmr.org |
Original Article
Volume 4, Number 3, June 2012, pages 177-189
Particle Depositions and Related Hemodynamic Parameters in the Multiple Stenosed Right Coronary Artery
Figures
Tables
| Variables | Value |
|---|---|
| MI = myocardial infarction, PTCA = percutaneous transluminal coronary angioplasty, RCA = right coronary artery | |
| Mean age | 44 |
| Gender (M/F) | Male |
| History of MI | NO |
| Previous PTCA | NO |
| Renal insufficiency | NO |
| Cardiovascular risk factor | |
| Hypertension | Yes |
| Diabetes | NO |
| Smoke | Yes |
| Obesity | Moderate |
| Angiographic data | |
| RCA stenosis | multiple/severe |
| Stenosis | Reference diameter (mm) | Stenosis minimal diameter (mm) | Stenosis length (mm) | Diameter reduction percentage (%) | Area reduction percentage (%) |
|---|---|---|---|---|---|
| ST1 | 3.8 | 1.76 | 12 | 54 | 77 |
| ST2 | 3.6 | 2.6 | 7 | 28 | 53 |
| ST3 | 3.6 | 1.68 | 7 | 53 | 80 |
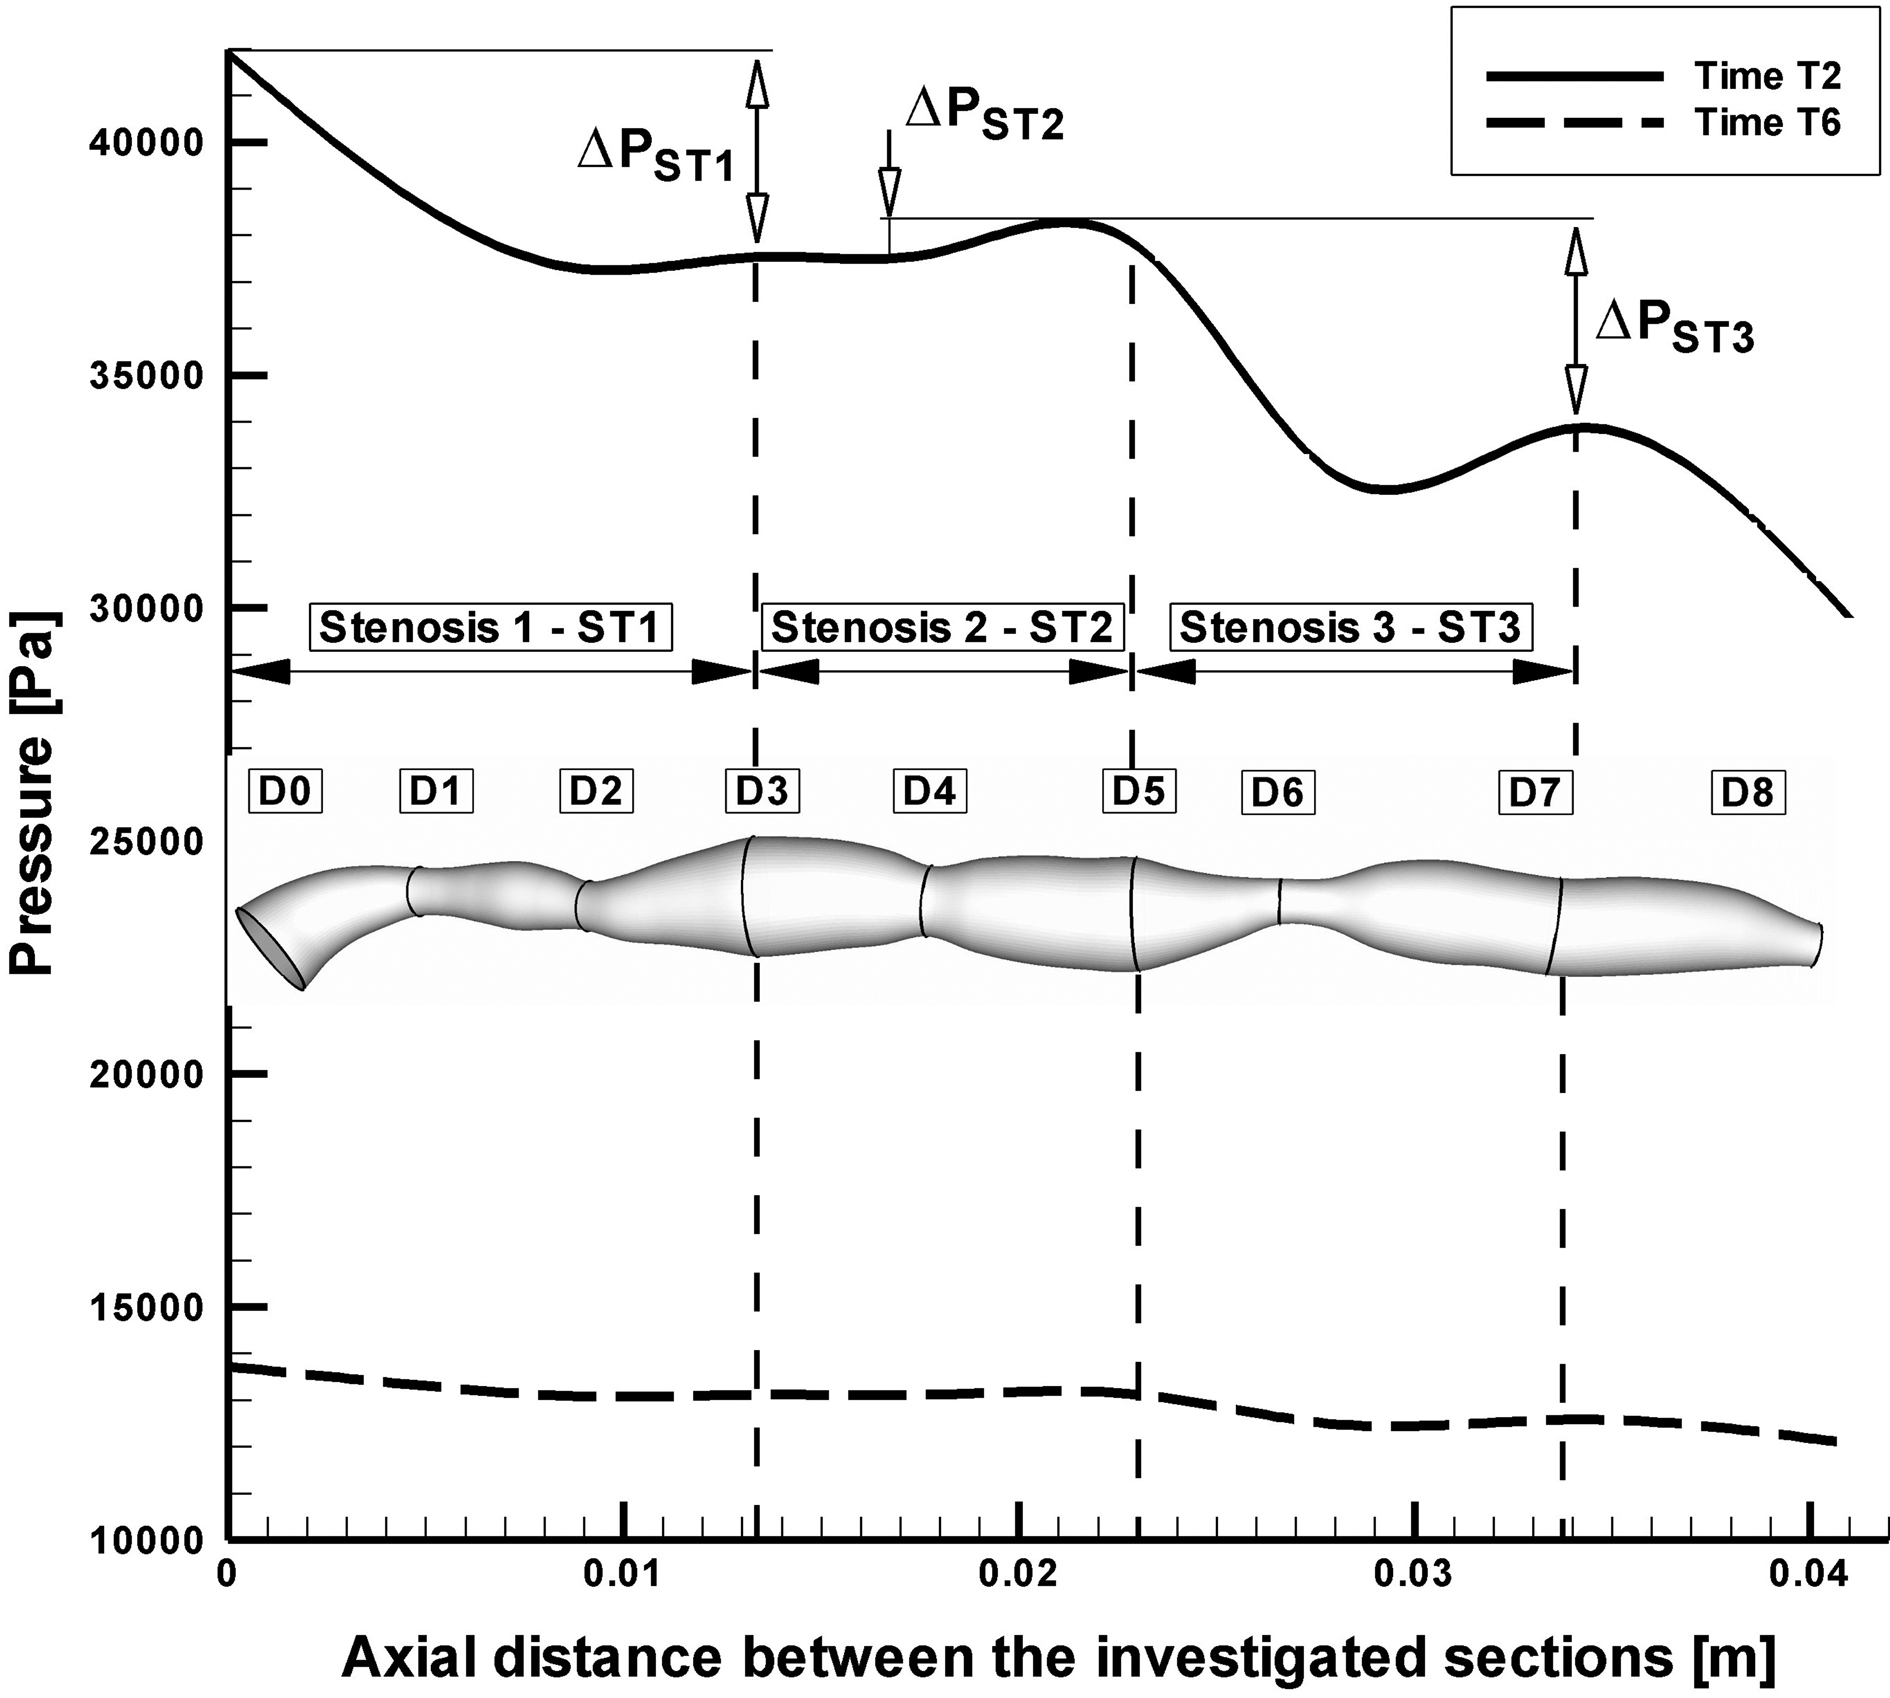
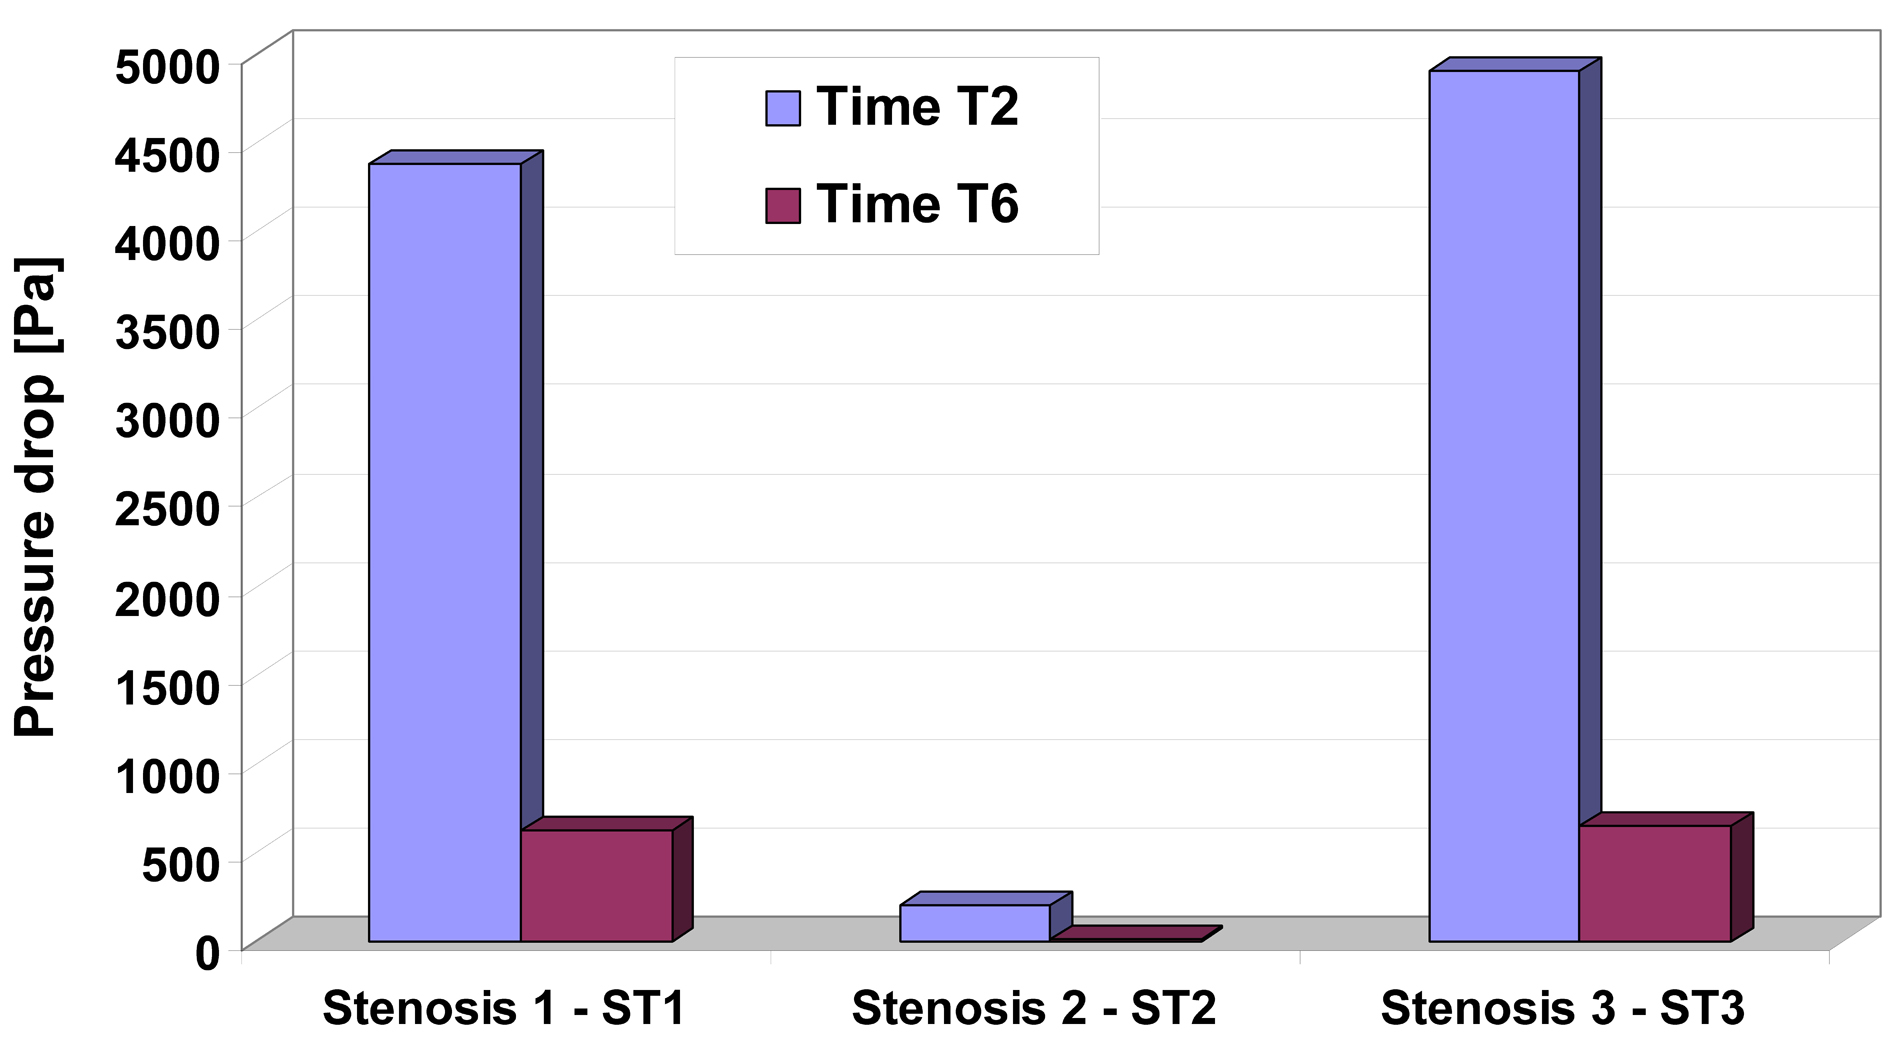
| Stenosis | Time | Q (l/min) | ΔP (mmHg) | Rethroat | Vmaxthroat | WSSmax | WSSmin |
|---|---|---|---|---|---|---|---|
| ST1 | T2 | 0.351 | 32.84 | 1141 | 2.27 | 210 | 10 |
| T6 | 0.113 | 4.62 | 369 | 0.734 | 45 | 20 | |
| ST2 | T2 | 0.37 | 1.46 | 865 | 1.165 | 110 | 10 |
| T6 | 0.118 | 0.03 | 275 | 0.371 | 20 | 10 | |
| ST3 | T2 | 0.35 | 36.78 | 1118 | 2.33 | 250 | 10 |
| T6 | 0.112 | 4.81 | 361 | 0.752 | 50 | 10 |
| Hemodynamic characteristics | Present study | Experimental Li et al. [29] for 2D model | In vivo data | |||
|---|---|---|---|---|---|---|
| %DS | Value | %DS | Value | %DS | Value | |
| %DS percent diameter stenosis; * pressure drop from the inlet to the throat; 1Di Mario et al [27]; 2Siebes et al [28]. | ||||||
| Peak velocity (m/s) | 28% - ST2 | 1.165 | 30% | 1.47 | - | - |
| 53% - ST1 | 2.27 | 70% | 3.2 | 169.1 ± 4.8% | 2.1 ± 2.8 | |
| Reynolds number in the throat (-) | 28% - ST2 | 865 | 30% | 528 | - | - |
| 53% - ST1 | 1141 | 70% | 1206 | - | - | |
| Peak WSS (Pa) | 28% - ST2 | 110 | 30% | 45 | - | - |
| 53% - ST1 | 210 | 70% | 230 | - | - | |
| Pressure drop (mmHg) | 28% - ST2 | 0.03 | 30% | *8.25 | - | - |
| 53% - ST1 | 32.84 | 70% | *39.75 | 252.2 ± 8.6% | 36.9 ± 17.3 | |