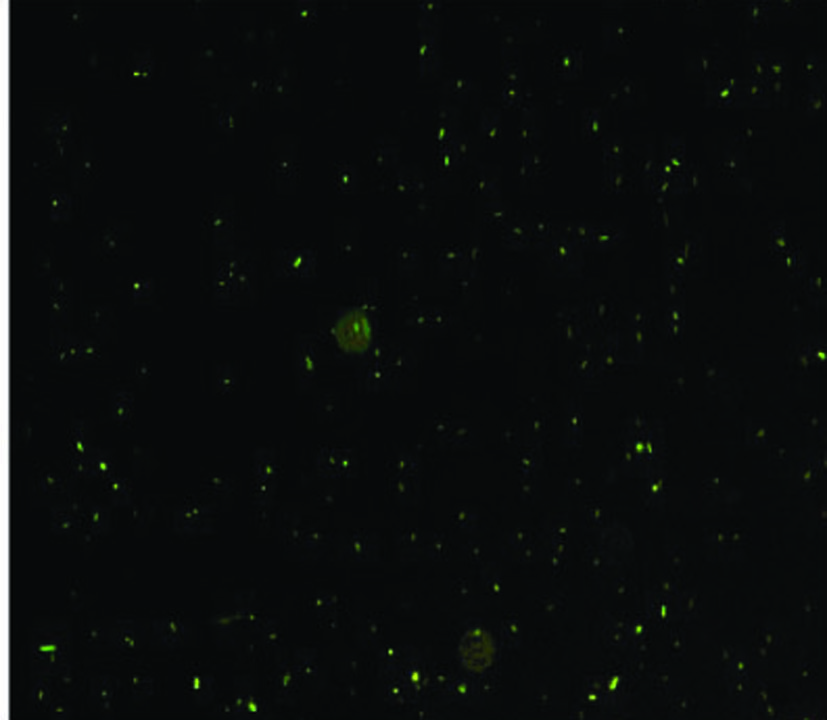
Figure 1.. The E. coli with GFP were detected with fluorescence microscope. The cells displayed rod shape and erupted fluorescent light.
| Journal of Clinical Medicine Research, ISSN 1918-3003 print, 1918-3011 online, Open Access |
| Article copyright, the authors; Journal compilation copyright, J Clin Med Res and Elmer Press Inc |
| Journal website http://www.jocmr.org |
Original Article
Volume 3, Number 2, April 2011, pages 78-84
Protective Effects of L-Carnitine on Intestinal Ischemia/Reperfusion Injury in a Rat Model
Figures
Tables
| Classification | Pathological change |
|---|---|
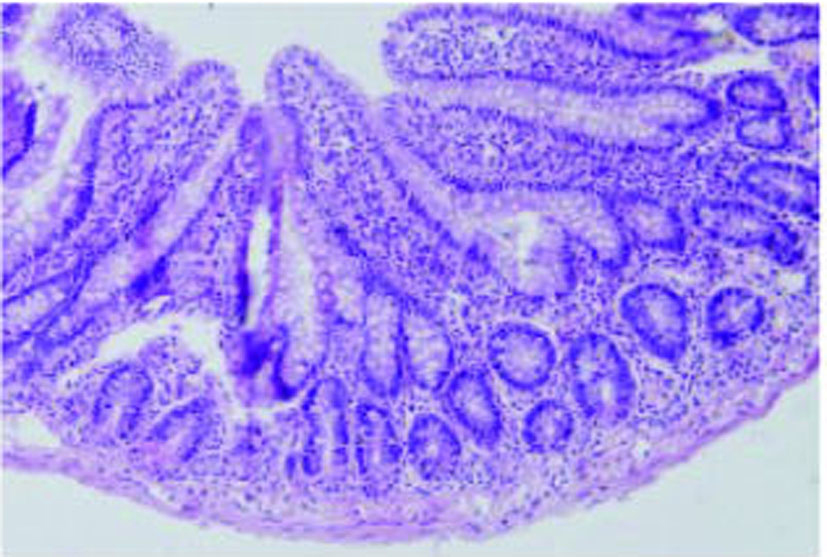
| Level 0 | Mucosa without changes. |
| Level 1 | Well-constituted villosities, no cellular lysis or inflammatory process, although there is formation of Grunhagen’s sub-epithelial space. |
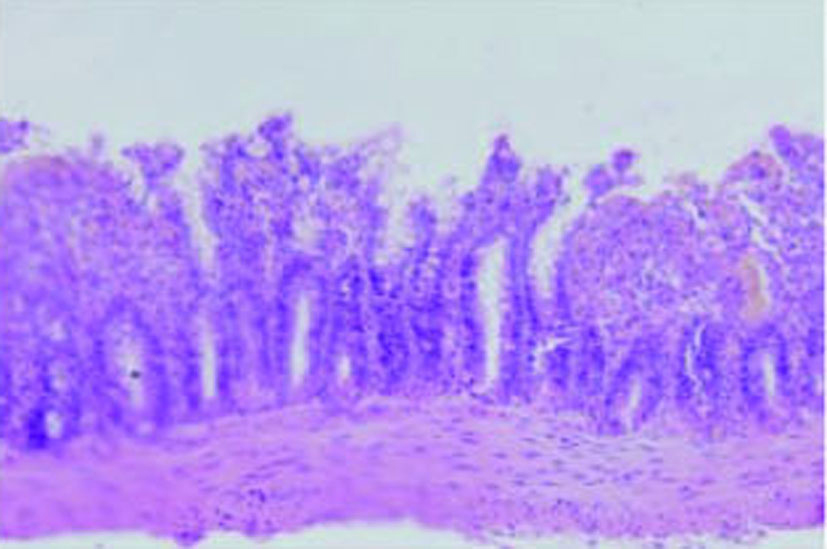
| Level 2 | Presence of cellular lysis, formation of Grunhagen’s sub-epithelial space and increased spacing among the villosities. |
| Level 3 | Destruction of the free villosities section, presence of dilated capillaries and inflamed cells. |
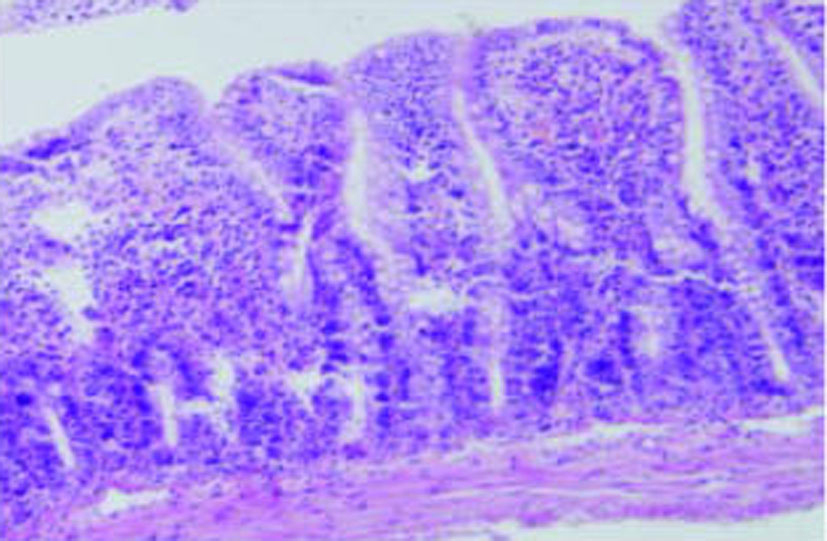
| Level 4 | Structural destruction of the villosities, only traces of some villosities, formed by inflamed cells and necrotic material, with hemorrhage and basal glandular ulceration. |
| Level 5 | Destruction of all the mucosa, no glandular structure can be seen, only the amorphous material laying on the sub-mucosa tissue. |
| Groups | n | MLN | Liver | Lung | Spleen | Portal vein blood |
|---|---|---|---|---|---|---|
| ± P < 0.05 compared to IR and IR+L groups* P < 0.05 compared to IR+L group | ||||||
| S | 10 | 1.2 ± 1.03Δ | 0.0 ± 0.00Δ | 0.0 ± 0.00Δ | 0.0 ± 0.00Δ | 2.0± 2.58Δ |
| IR | 10 | 25.1 ± 3.41* | 20.5 ± 3.03* | 25.5 ± 3.92* | 15.2 ± 3.01* | 19.9 ± 3.70* |
| IR+L | 10 | 11.3 ± 2.36 | 10.0 ± 2.58 | 10.8 ± 2.25 | 10.3 ± 3.43 | 9.3 ± 1.64 |
| Groups | n | Small intestinal structure |
|---|---|---|
| Δ P < 0.05 compared to IR and IR+L groups* P < 0.05 compared to IR+L group | ||
| S | 10 | 0 ± 0.00Δ |
| IR | 10 | 4.0 ± 0.41* |
| IR+L | 10 | 2.4 ± 0.46 |
| Groups | n | TNF-α | IL-1 | IL-6 | >IL-10 |
|---|---|---|---|---|---|
| Δ P < 0.05 compared to IR and IR+L groups* P < 0.05 compared to IR+L group | |||||
| S | 10 | 53.82 ± 8.94Δ | 195.52 ± 52.26Δ | 259.89 ± 89.41Δ | 359.38 ± 76.32Δ |
| IR | 10 | 575.02 ± 50.56* | 601.29 ± 58.33* | 567.25 ± 69.62* | 126.06 ± 50.37* |
| IR+L | 10 | 104.86 ± 10.61 | 291.58 ± 76.88 | 258.75 ± 77.58 | 254.65 ± 67.91 |