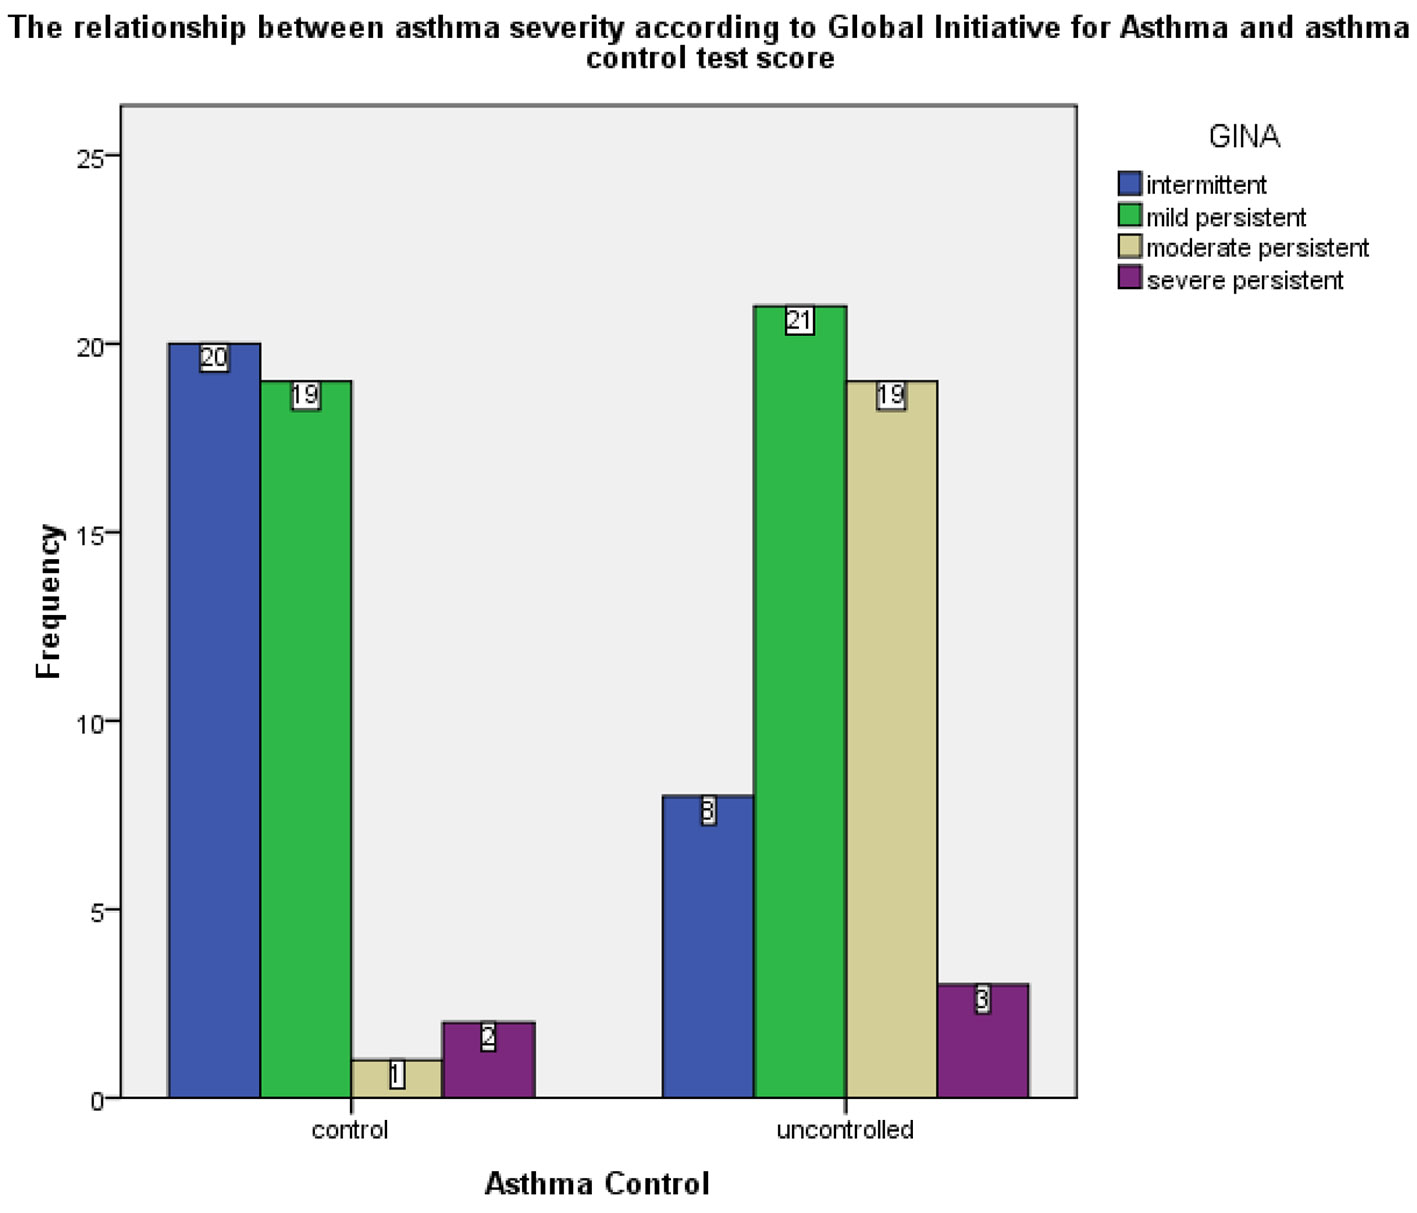
Figure 1. Frequency of GINA-based asthma severity cases in the controlled and uncontrolled asthma groups. GINA: Global Initiative for Asthma.
| Journal of Clinical Medicine Research, ISSN 1918-3003 print, 1918-3011 online, Open Access |
| Article copyright, the authors; Journal compilation copyright, J Clin Med Res and Elmer Press Inc |
| Journal website http://www.jocmr.org |
Original Article
Volume 11, Number 12, December 2019, pages 807-817
Asthma Control and Its Predictive Factors in Adult Asthma Patients
Figures
Tables
| Variable | Mean ± SD | Number (N = 93) | Percentage |
|---|---|---|---|
| GINA: Global Initiative for Asthma; SD: standard deviation. | |||
| Weight (kg) | 73.25 ± 13.3 | ||
| Height (cm) | 163.3 ± 9.6 | ||
| Body mass index (kg/m2) | 27.6 ± 5.0 | ||
| Age (years) | 40.5 ± 13.6 | ||
| Duration of asthma diagnosis (years) | 7.3 ± 7.9 | ||
| Gender | |||
| Male | 34 | 36.6 | |
| Female | 59 | 63.4 | |
| Atopy | |||
| Positive | 54 | 58.1 | |
| Negative | 39 | 41.9 | |
| Allergic to two or more allergens | 33 | 35.5 | |
| Allergic to three or more allergens | 13 | 14 | |
| Mean asthma control test score | 16.6 ± 6.0 | ||
| Asthma control test | |||
| Controlled | 42 | 45.2 | |
| Partially controlled | 17 | 18.3 | |
| Uncontrolled | 34 | 36.6 | |
| GINA classification | |||
| Intermittent | 28 | 30.1 | |
| Mild persistent | 40 | 43.0 | |
| Moderate persistent | 20 | 21.5 | |
| Severe persistent | 5 | 5.4 | |
| Smoking history | |||
| Positive | 26 | 28 | |
| Negative | 67 | 72 | |
| Influenza vaccination history | |||
| Positive | 28 | 30.1 | |
| Negative | 65 | 69.9 | |
| Comorbidity | |||
| Allergic rhinitis | 62 | 66.7 | |
| Allergic conjunctivitis | 46 | 49.5 | |
| Food allergy | 5 | 5.4 | |
| Eczema | 24 | 25.8 | |
| Other chronic disease | 26 | 28 | |
| Presence of chronic disease | |||
| Yes | 26 | 28 | |
| No | 67 | 72 | |
| Treatment | |||
| Inhaled corticosteroids | 36 | 38.7 | |
| Oral β2-agonist | 19 | 20.4 | |
| Inhaled β2-agonist | 62 | 66.7 | |
| No treatment | 21 | 22.6 | |
| Controlled asthma (n, %) | Partly controlled asthma (n, %) | Uncontrolled asthma (n, %) | P | |
|---|---|---|---|---|
| Absolute number and percentage in brackets. | ||||
| Total study group (n = 93) | ||||
| Sex | ||||
| Female | 27 (29) | 13 (14) | 19 (20.4) | |
| Male | 15 (16.1) | 4 (4.3) | 15 (16.1) | |
| Age group | 0.00 | |||
| < 55 years | 42 (45.2) | 14 (15.1) | 21 (22.6) | |
| ≥ 55 years | 0 | 3 (3.2) | 13 (14) | |
| Body mass index (kg/m2) | ||||
| < 30 | 30 (32.3) | 14 (15.1) | 24 (25.8) | |
| ≥ 30 | 12 (12.9) | 3 (3.2) | 10 (10.8) | |
| Duration of asthma diagnosis (years) | 5.4 | 7.1 | 9.7 | 0.037 |
| Atopy | 0.00 | |||
| Positive | 12 (12.9) | 13 (14) | 29 (31.2) | |
| Negative | 30 (32.3) | 4 (4.3) | 5 (5.4) | |
| Allergic to two or more allergens | 4 (4.3) | 9 (9.7) | 20 (21.5) | 0.00 |
| Allergic to three or more allergens | 2 (2.2) | 2 (2.2) | 9 (9.7) | 0.024 |
| Comorbidity | 0.015 | |||
| Allergic rhinitis | 23 (24.7) | 10 (10.8) | 29 (31.2) | |
| Allergic conjunctivitis | 22 (23.7) | 12 (12.9) | 12 (12.9) | |
| Food allergy | 1 (1.1) | 2 (2.2) | 2 (2.2) | |
| Eczema | 9 (9.7) | 7 (7.5) | 8 (8.6) | |
| Other chronic disease | 10 (10.8) | 3 (3.2) | 13 (14) | |
| History of smoking | ||||
| Positive | 12 (12.9) | 4 (4.3) | 10 (10.8) | |
| Negative | 30 (32.3) | 13 (14) | 24 (25.8) | |
| Presence of chronic disease | ||||
| Yes | 10 (10.8) | 3 (3.2) | 13 (14) | |
| No | 32 (34.4) | 14 (15.1) | 21 (22.6) | |
| History of flu-vaccine | ||||
| Positive | 14 (15.1) | 5 (5.4) | 9 (9.7) | |
| Negative | 28 (30.1) | 12 (12.9) | 25 (26.9) | |
| Treatment | 0.02 | |||
| Yes | 28 (30.1) | 17 (18.3) | 27 (29) | |
| No | 14 (15.1) | 0 | 7 (7.5) | |
| GINA | Asthma control test | Chi-squared | P | |
|---|---|---|---|---|
| Controlled (n, %) | Uncontrolled (n, %) | |||
| Absolute number and percentage in brackets. GINA: Global Initiative for Asthma. | ||||
| Intermittent | 20 (21.5%) | 8 (8.6%) | 20.97 | 0.00 |
| Mild persistent | 19 (20.4%) | 21 (22.6%) | ||
| Moderate persistent | 1 (1.1%) | 19 (20.4%) | ||
| Severe persistent | 2 (2.2%) | 3 (3.2%) | ||
| Allergy test | Inhaled corticosteroids | Chi-squared | P | |
|---|---|---|---|---|
| No, N (%) | Yes, N (%) | |||
| Absolute number and percentage in brackets. | ||||
| Negative | 33 (61.1) | 21 (38.9) | 0.002 | > 0.05 |
| Positive | 24 (61.5) | 15 (38.5) | ||
| Variable | Adjusted OR | 95% CI (OR) | χ2 Stat. (df) | P |
|---|---|---|---|---|
| MLR: multiple logistic regression; GINA: Global Initiative for Asthma; OR: odds ratio; CI: confidence interval. | ||||
| GINA | 2.2 | 1.011 - 4.714 | 4.0 | 0.047 |
| Allergy positive to two allergens or more | 17.2 | 4.301 - 68.702 | 16.2 | 0.00 |