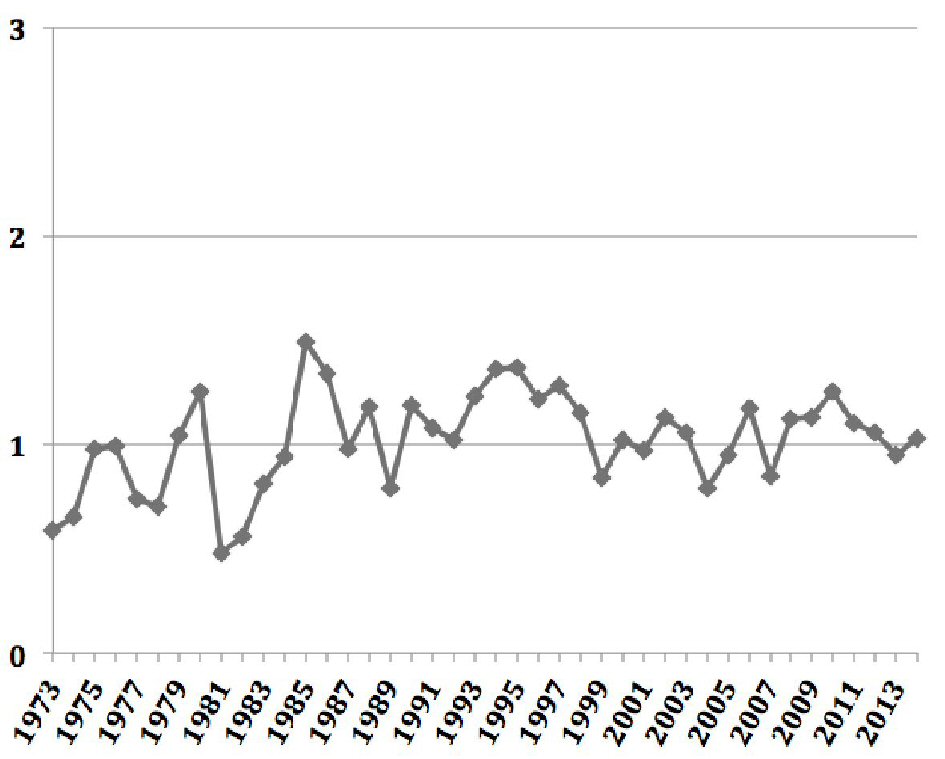
Figure 1. Age-adjusted annual incidence of adrenocortical carcinoma over time.
| Journal of Clinical Medicine Research, ISSN 1918-3003 print, 1918-3011 online, Open Access |
| Article copyright, the authors; Journal compilation copyright, J Clin Med Res and Elmer Press Inc |
| Journal website http://www.jocmr.org |
Original Article
Volume 10, Number 8, August 2018, pages 636-640
The Characteristics and Trends in Adrenocortical Carcinoma: A United States Population Based Study
Figures
Tables
| N (%) | |
|---|---|
| Total cases | 2,014 (100) |
| Year of diagnosis | |
| 1973 - 1984 | 187 (9.3) |
| 1985 - 1994 | 297 (14.7) |
| 1995 - 2004 | 597 (29.7) |
| 2005 - 2014 | 933 (46.3) |
| Gender | |
| Male | 861 (42.8) |
| Female | 1,153 (57.2) |
| Median age at diagnosis | 55 years |
| Age at diagnosis | |
| 00 - 09 years | 77 (3.8) |
| 10 - 19 years | 54 (2.7) |
| 20 - 29 years | 103 (5.1) |
| 30 - 39 years | 213 (10.6) |
| 40 - 49 years | 331 (16.4) |
| 50 - 59 years | 447 (22.2) |
| 60 - 69 years | 447 (22.2) |
| 70 - 79 years | 249 (12.4) |
| 80+ years | 93 (4.6) |
| Race | |
| White | 1,736 (86.2) |
| Black | 142 (7.1) |
| Others | 132 (6.7) |
| Primary malignancy | |
| One primary only | 1,618 (80.3) |
| More than one primary | 396 (19.7) |
| Laterality | |
| Unilateral, right | 874 (43.4) |
| Unilateral, left | 1,040 (51.6) |
| Bilateral | 20 (1) |
| Unknown | 80 (4) |
| Grade of tumor | |
| Well differentiated, grade I | 62 (14.8) |
| Moderately differentiated, grade II | 82 (19.6) |
| Poorly differentiated, grade III | 161 (38.4) |
| Undifferentiated, grade IV | 114 (27.2) |
| Unknown | 1,595 |
| Treatment | |
| Surgery | 1,482 (73.6) |
| Adjuvant radiotherapy | 159 (7.9) |
| Adjuvant chemotherapy | 406 (20.2) |
| Chemotherapy alone | 223 (11.1) |
| Cause specific mortality | |
| Overall | 1,051 (52.2) |
| 1973 - 1984 | 127 (67.9) |
| 1985 - 1994 | 160 (53.9) |
| 1995 - 2004 | 331 (55.4) |
| 2005 - 2014 | 433 (46.4) |
| Median survival | |
| Overall | 17 months |
| 1973 - 1984 | 14 months |
| 1985 - 1994 | 22 months |
| 1995 - 2004 | 28 months |
| 2005 - 2014 | 14 months |
| 1973 - 1984 N (%) | 1985 - 1994 N (%) | 1995 - 2004 N (%) | 2005 - 2014 N (%) | P-value | |
|---|---|---|---|---|---|
| Total cases | 187 (9.3) | 297 (14.7) | 597 (29.7) | 933 (46.3) | |
| Gender | |||||
| Female | 90 (48.1) | 157 (52.9) | 358 (60) | 548 (58.7) | 0.186 |
| Male | 97 (51.9) | 140 (47.1) | 239 (40) | 385 (41.3) | |
| Median age at diagnosis | 54 years | 56 years | 53 years | 55 years | 0.165 |
| Mean age at diagnosis | 50.13 ± 19.977 | 53.08 ± 17.616 | 51.37 ± 19.167 | 52.83 ± 18.752 | 0.162 |
| Age at diagnosis | |||||
| 00 - 09 years | 10 (5.4) | 9 (3) | 26 (4.3) | 32 (3.5) | 0.48 |
| 10 - 19 years | 8 (4.2) | 3 (1) | 15 (2.5) | 28 (3) | 0.15 |
| 20 - 29 years | 14 (7.4) | 15 (5.1) | 32 (5.3) | 42 (4.6) | 0.31 |
| 30 - 39 years | 16 (8.5) | 40 (13.4) | 70 (11.8) | 87 (9.3) | 0.13 |
| 40 - 49 years | 26 (13.9) | 38 (13.8) | 110 (18.4) | 157 (16.9) | 0.13 |
| 50 - 59 years | 40 (21.4) | 68 (22.9) | 117 (19.6) | 222 (23.8) | 0.3 |
| 60 - 69 years | 50 (26.8) | 72 (24.2) | 125 (20.9) | 200 (21.4) | 0.77 |
| 70 - 79 years | 19 (10.2) | 43 (14.5) | 72 (12.1) | 115 (12.4) | 0.36 |
| 80+ years | 5 (2.1) | 9 (3.1) | 30 (5) | 50 (5.3) | 0.18 |
| Race | |||||
| White | 167 (89.4) | 257 (86.5) | 521 (87.3) | 791 (84.8) | 0.92 |
| Black | 10 (5.3) | 26 (8.8) | 33 (5.5) | 73 (7.8) | |
| Others | 10 (5.3) | 14 (4.7) | 43 (7.2) | 69 (7.4) | |
| Primary malignancy | |||||
| One primary only | 154 (82.4) | 225 (75.8) | 476 (79.7) | 763 (81.8) | 0.77 |
| More than one primary | 33 (17.6) | 72 (24.2) | 121 (20.3) | 170 (18.2) | |
| Laterality | |||||
| Unilateral | 164 (87.7) | 287 (96.7) | 566 (94.8) | 897 (96.2) | 0.71 |
| Bilateral | 7 (3.7) | 2 (0.7) | 6 (1) | 5 (0.5) | |
| Unknown | 16 (8.6) | 8 (2.7) | 25 (4.2) | 31 (3.3) | |
| Grade of tumor | |||||
| Poorly differentiated and undifferentiated; grade III and IV | 13 (42) | 44 (64.7) | 93 (64.6) | 125 (71) | 0.04 |
| Treatment | |||||
| Surgery | 131 (70.1) | 233 (78.5) | 452 (75.7) | 666 (71.4) | 0.71 |
| Adjuvant radiotherapy | 13 (7) | 21 (7.1) | 29 (4.9) | 96 (10.3) | 0.003 |
| Adjuvant chemotherapy | 27 (14.4) | 44 (14.8) | 85 (14.2) | 250 (26.8) | P < 0.05 |
| Chemotherapy alone | 18 (9.6) | 27 (9.1) | 50 (8.4) | 128 (13.7) | 0.009 |
| Median survival | 14 months | 22 months | 28 months | 14 months | P < 0.05 |
| Mean survival | 77.35 ± 132.7 | 80.82 ± 105.7 | 64.04 ± 69.79 | 25.76 ± 29.184 | P < 0.05 |