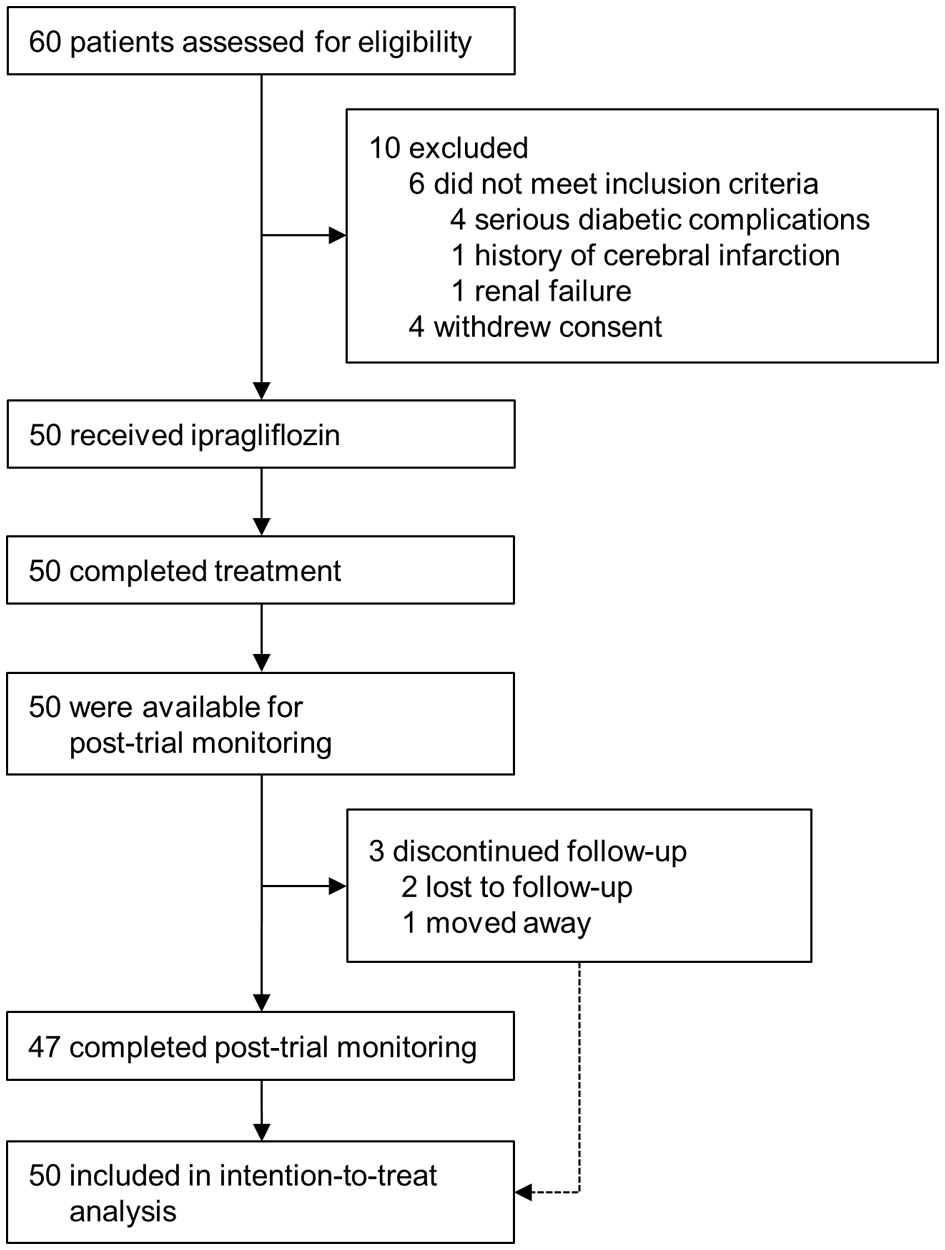
Figure 1. Enrollment and outcomes.
| Journal of Clinical Medicine Research, ISSN 1918-3003 print, 1918-3011 online, Open Access |
| Article copyright, the authors; Journal compilation copyright, J Clin Med Res and Elmer Press Inc |
| Journal website http://www.jocmr.org |
Original Article
Volume 10, Number 9, September 2018, pages 679-687
Long-Term Effects of Ipragliflozin on Diabetic Nephropathy and Blood Pressure in Patients With Type 2 Diabetes: 104-Week Follow-up of an Open-Label Study
Figures
Tables
| All patients | Diabetic nephropathy | |
|---|---|---|
| Data are n (%), means ± standard deviation (SD). DPP-4: dipeptidyl peptidase-4; ARB: angiotensin II receptor blocker; ACE: angiotensin-converting enzyme. | ||
| Number of patients | 50 | 16 |
| Male/female (n) | 16/34 | 6/10 |
| Age (years) | 53.2 ± 12.5 | 53.8 ± 13.3 |
| Duration of diabetes (years) | 9.1 ± 6.0 | 9.9 ± 7.2 |
| Body mass index (kg/m2) | 30.6 ± 6.2 | 32.1 ± 4.5 |
| Fasting C-peptide (ng/mL) | 3.4 ± 1.8 | 3.5 ± 1.03 |
| Medications | ||
| Metformin (%) | 31 (62.0%) | 10 (62.5%) |
| DPP-4 inhibitor (%) | 31 (62.0%) | 8 (50.0%) |
| Sulfonylurea (%) | 10 (20.0%) | 2 (12.5%) |
| Insulin (%) | 12 (24.0%) | 5 (31.3%) |
| ARB or ACE inhibitor (%) | 32 (64.0%) | 13 (81.3%) |
| Statin (%) | 32 (64.0%) | 10 (62.5%) |
| Interventional trial period | P value (week 24 vs. baseline) | Post-trial monitoring period | P value (week 104 vs. baseline) | |||
|---|---|---|---|---|---|---|
| Baseline | Week 24 | Week 52 | Week 104 | |||
| Data are means ± standard deviation (SD) or medians with the interquartile range (IQR). P value versus baseline by the paired t-test. †P value versus baseline by the Wilcoxon signed-rank test. HbA1c: glycated hemoglobin; UACR: urinary albumin-to-creatinine ratio; eGFR: estimated glomerular filtration rate; SBP: systolic blood pressure; DBP: diastolic blood pressure; HOMA-IR: homeostasis model assessment of insulin resistance; HOMA-β: homeostasis model assessment of β-cell function; LDL-cholesterol: low-density lipoprotein cholesterol; HDL-cholesterol: high-density lipoprotein cholesterol; AST: aspartate aminotransferase; ALT: alanine aminotransferase; γ-GT: γ- glutamyltransferase. | ||||||
| HbA1c (%) | 8.7 ± 1.5 | 7.7 ± 1.2 | < 0.001 | 7.7 ± 1.3 | 7.6 ± 1.2 | < 0.001 |
| Fasting plasma glucose (mg/dL) | 165.5 ± 40.5 | 137.6 ± 25.6 | < 0.001 | 148.1 ± 39.4 | 146.9 ± 34.7 | 0.020 |
| Body weight (kg) | 78.4 ± 19.7 | 75.8 ± 20.1 | < 0.001 | 76.0 ± 20.1 | 76.5 ± 20.6 | < 0.001 |
| UACR (mg/gCr) | 15.5 (8.0 - 95.7) | 12.9 (7.4 - 36.3) | 0.011† | 15.2 (8.0 - 39.0) | 14.0 (7.3 - 34.6) | 0.053† |
| eGFR (mL/min/1.73m2) | 82.1 ± 19.8 | 78.5 ± 17.4 | 0.007 | 82.2 ± 20.7 | 81.0 ± 20.2 | 0.526 |
| SBP (mm Hg) | 131.8 ± 13.1 | 130.1 ± 13.0 | 0.389 | 130.1 ± 14.9 | 130.5 ± 12.0 | 0.755 |
| DBP (mm Hg) | 80.7 ± 11.0 | 80.8 ± 10.5 | 0.888 | 80.9 ± 12.9 | 79.4 ± 10.9 | 0.411 |
| Fasting serum insulin (µU/mL) | 13.4 ± 6.3 | 13.2 ± 11.5 | 0.924 | 13.4 ± 11.7 | 12.9 ± 11.2 | 0.745 |
| HOMA-IR | 5.5 ± 3.4 | 4.7 ± 5.0 | 0.378 | 5.0 ± 5.0 | 4.7 ± 4.8 | 0.369 |
| HOMA-β (%) | 54.7 ± 35.3 | 67.0 ± 44.0 | 0.064 | 62.4 ± 45.4 | 61.1 ± 42.9 | 0.336 |
| Total cholesterol (mg/dL) | 180.8 ± 39.8 | 184.1 ± 39.8 | 0.274 | 178.4 ± 34.9 | 182.3 ± 33.3 | 0.720 |
| LDL-cholesterol (mg/dL) | 106.1 ± 32.2 | 109.3 ± 34.1 | 0.199 | 105.2 ± 30.1 | 107.7 ± 25.9 | 0.655 |
| HDL-cholesterol (mg/dL) | 48.3 ± 9.51 | 54.1 ± 10.4 | < 0.001 | 52.6 ± 9.5 | 53.5 ± 8.8 | < 0.001 |
| Triglycerides (mg/dL) | 157.1 ± 77.3 | 134.1 ± 71.7 | 0.028 | 149.1 ± 80.7 | 159.8 ± 98.3 | 0.849 |
| AST (IU/L) | 39.4 ± 16.7 | 26.0 ± 8.6 | < 0.001 | 28.2 ± 11.8 | 33.1 ± 19.7 | 0.044 |
| ALT (IU/L) | 56.2 ± 29.7 | 35.6 ± 19.5 | < 0.001 | 38.8 ± 21.0 | 44.6 ± 33.4 | 0.003 |
| γ-GT (IU/L) | 62.3 ± 55.6 | 41.0 ± 34.5 | < 0.001 | 45.1 ± 57.5 | 54.0 ± 84.0 | 0.396 |
| Uric acid (mg/dL) | 5.5 ± 1.3 | 4.7 ± 1.1 | < 0.001 | 4.9 ± 1.2 | 4.9 ± 1.3 | < 0.001 |
| Serum creatinine (mg/dL) | 0.68 ± 0.16 | 0.71 ± 0.16 | 0.011 | 0.68 ± 0.16 | 0.68 ± 0.17 | 0.721 |
| Hematocrit (%) | 42.6 ± 4.1 | 45.4 ± 4.5 | < 0.001 | 44.8 ± 4.8 | 45.5 ± 4.3 | < 0.001 |
| Interventional trial period | P value (week 24 vs. baseline) | Post-trial monitoring period | P value (week 104 vs. baseline) | |||
|---|---|---|---|---|---|---|
| Baseline | Week 24 | Week 52 | Week 104 | |||
| Data are means ± standard deviation (SD) or medians with the interquartile range (IQR). P value versus baseline by the paired t-test. †P value versus baseline by the Wilcoxon signed-rank test. HbA1c: glycated hemoglobin; UACR: urinary albumin-to-creatinine ratio; eGFR: estimated glomerular filtration rate; SBP: systolic blood pressure; DBP: diastolic blood pressure; HOMA-IR: homeostasis model assessment of insulin resistance; HOMA-β: homeostasis model assessment of β-cell function; LDL-cholesterol: low-density lipoprotein cholesterol; HDL-cholesterol: high-density lipoprotein cholesterol; AST: aspartate aminotransferase; ALT: alanine aminotransferase; γ-GT: γ- glutamyltransferase. | ||||||
| HbA1c (%) | 9.0 ± 1.8 | 8.0 ± 1.2 | 0.013 | 7.7 ± 1.4 | 7.7 ± 1.0 | 0.006 |
| Fasting plasma glucose (mg/dL) | 162.5 ± 32.1 | 135.9 ± 20.2 | 0.028 | 141.9 ± 32.5 | 138.5 ± 26.0 | 0.033 |
| Body weight (kg) | 82.9 ± 15.7 | 80.2 ± 15.9 | < 0.001 | 80.5 ± 15.5 | 82.1 ± 18.2 | < 0.001 |
| UACR (mg/gCr) | 119.2 (98.9 - 201.8) | 52.9 (24.8 - 242.1) | 0.049† | 81.8 (24.3 - 174.3) | 36.9 (19.7 - 204.7) | 0.011† |
| eGFR (mL/min/1.73m2) | 77.9 ± 20.2 | 73.3 ± 16.9 | 0.080 | 75.8 ± 17.3 | 77.9 ± 18.6 | 0.986 |
| SBP (mm Hg) | 135.5 ± 17.2 | 134.3 ± 14.5 | 0.822 | 134.1 ± 13.3 | 136.4 ± 11.6 | 0.596 |
| DBP (mm Hg) | 83.9 ± 12.4 | 84.7 ± 11.4 | 0.769 | 85.8 ± 11.0 | 82.7 ± 9.9 | 0.762 |
| Fasting serum insulin (µU/mL) | 14.5 ± 6.0 | 18.3 ± 16.4 | 0.325 | 17.5 ± 16.6 | 16.4 ± 16.2 | 0.632 |
| HOMA-IR | 5.7 ± 2.5 | 6.5 ± 7.2 | 0.702 | 6.6 ± 7.2 | 6.2 ± 7.2 | 0.838 |
| HOMA-β (%) | 59.4 ± 41.3 | 88.5 ± 55.9 | 0.024 | 76.6 ± 58.5 | 70.8 ± 52.8 | 0.236 |
| Total cholesterol (mg/dL) | 184.6 ± 31.9 | 183.2 ± 19.7 | 0.848 | 172.8 ± 28.0 | 181.0 ± 33.8 | 0.687 |
| LDL-cholesterol (mg/dL) | 107.0 ± 32.2 | 104.6 ± 20.4 | 0.483 | 99.4 ± 23.9 | 107.2 ± 22.9 | 0.976 |
| HDL-cholesterol (mg/dL) | 48.9 ± 8.8 | 54.2 ± 10.5 | 0.036 | 52.7 ± 7.2 | 54.2 ± 6.8 | 0.001 |
| Triglycerides (mg/dL) | 168.1 ± 82.2 | 140.3 ± 84.3 | 0.160 | 133.4 ± 44.3 | 158.4 ± 104.7 | 0.760 |
| AST (IU/L) | 39.0 ± 17.8 | 27.2 ± 11.5 | < 0.001 | 25.5 ± 9.9 | 31.1 ± 16.9 | 0.075 |
| ALT (IU/L) | 55.9 ± 32.7 | 40.9 ± 27.9 | < 0.001 | 37.1 ± 20.5 | 42.5 ± 29.2 | 0.003 |
| γ-GT (IU/L) | 54.2 ± 34.8 | 37.3 ± 22.6 | < 0.001 | 33.8 ± 18.6 | 37.1 ± 29.2 | 0.003 |
| Uric acid (mg/dL) | 5.9 ± 1.4 | 5.2 ± 1.2 | 0.022 | 5.4 ± 1.4 | 5.3 ± 1.1 | 0.010 |
| Serum creatinine (mg/dL) | 0.73 ± 0.18 | 0.77 ± 0.19 | 0.113 | 0.73 ± 0.18 | 0.72 ± 0.18 | 0.261 |
| Hematocrit (%) | 42.8 ± 4.1 | 45.9 ± 4.9 | < 0.001 | 46.2 ± 5.1 | 46.0 ± 4.9 | < 0.001 |
| Interventional trial period (week 24) | Post-trial monitoring period (week 104) | |||||||
|---|---|---|---|---|---|---|---|---|
| All patients (n = 50) | Diabetic nephropathy (n = 16) | All patients (n = 50) | Diabetic nephropathy (n = 16) | |||||
| ΔUACR (mg/gCr) | ΔUACR (mg/gCr) | ΔUACR (mg/gCr) | ΔUACR (mg/gCr) | |||||
| r | P | r | P | r | P | r | P | |
| The relationship between changes in UACR and blood pressure, HbA1c, and body weight were assessed using Pearson’s correlation coefficients. Δ: the amount of change week 24 or week 104 after baseline. UACR: urinary albumin-to-creatinine ratio; HbA1c: glycated hemoglobin; SBP: systolic blood pressure; DBP: diastolic blood pressure; BW: body weight. | ||||||||
| ΔSBP (mm Hg) | 0.342 | 0.015 | 0.504 | 0.047 | 0.074 | 0.619 | 0.140 | 0.606 |
| ΔDBP (mm Hg) | 0.110 | 0.445 | 0.148 | 0.585 | 0.057 | 0.698 | 0.044 | 0.870 |
| ΔHbA1c (%) | 0.041 | 0.780 | 0.048 | 0.860 | -0.058 | 0.697 | -0.135 | 0.617 |
| ΔBW (kg) | 0.218 | 0.128 | 0.476 | 0.062 | -0.071 | 0.631 | -0.017 | 0.949 |