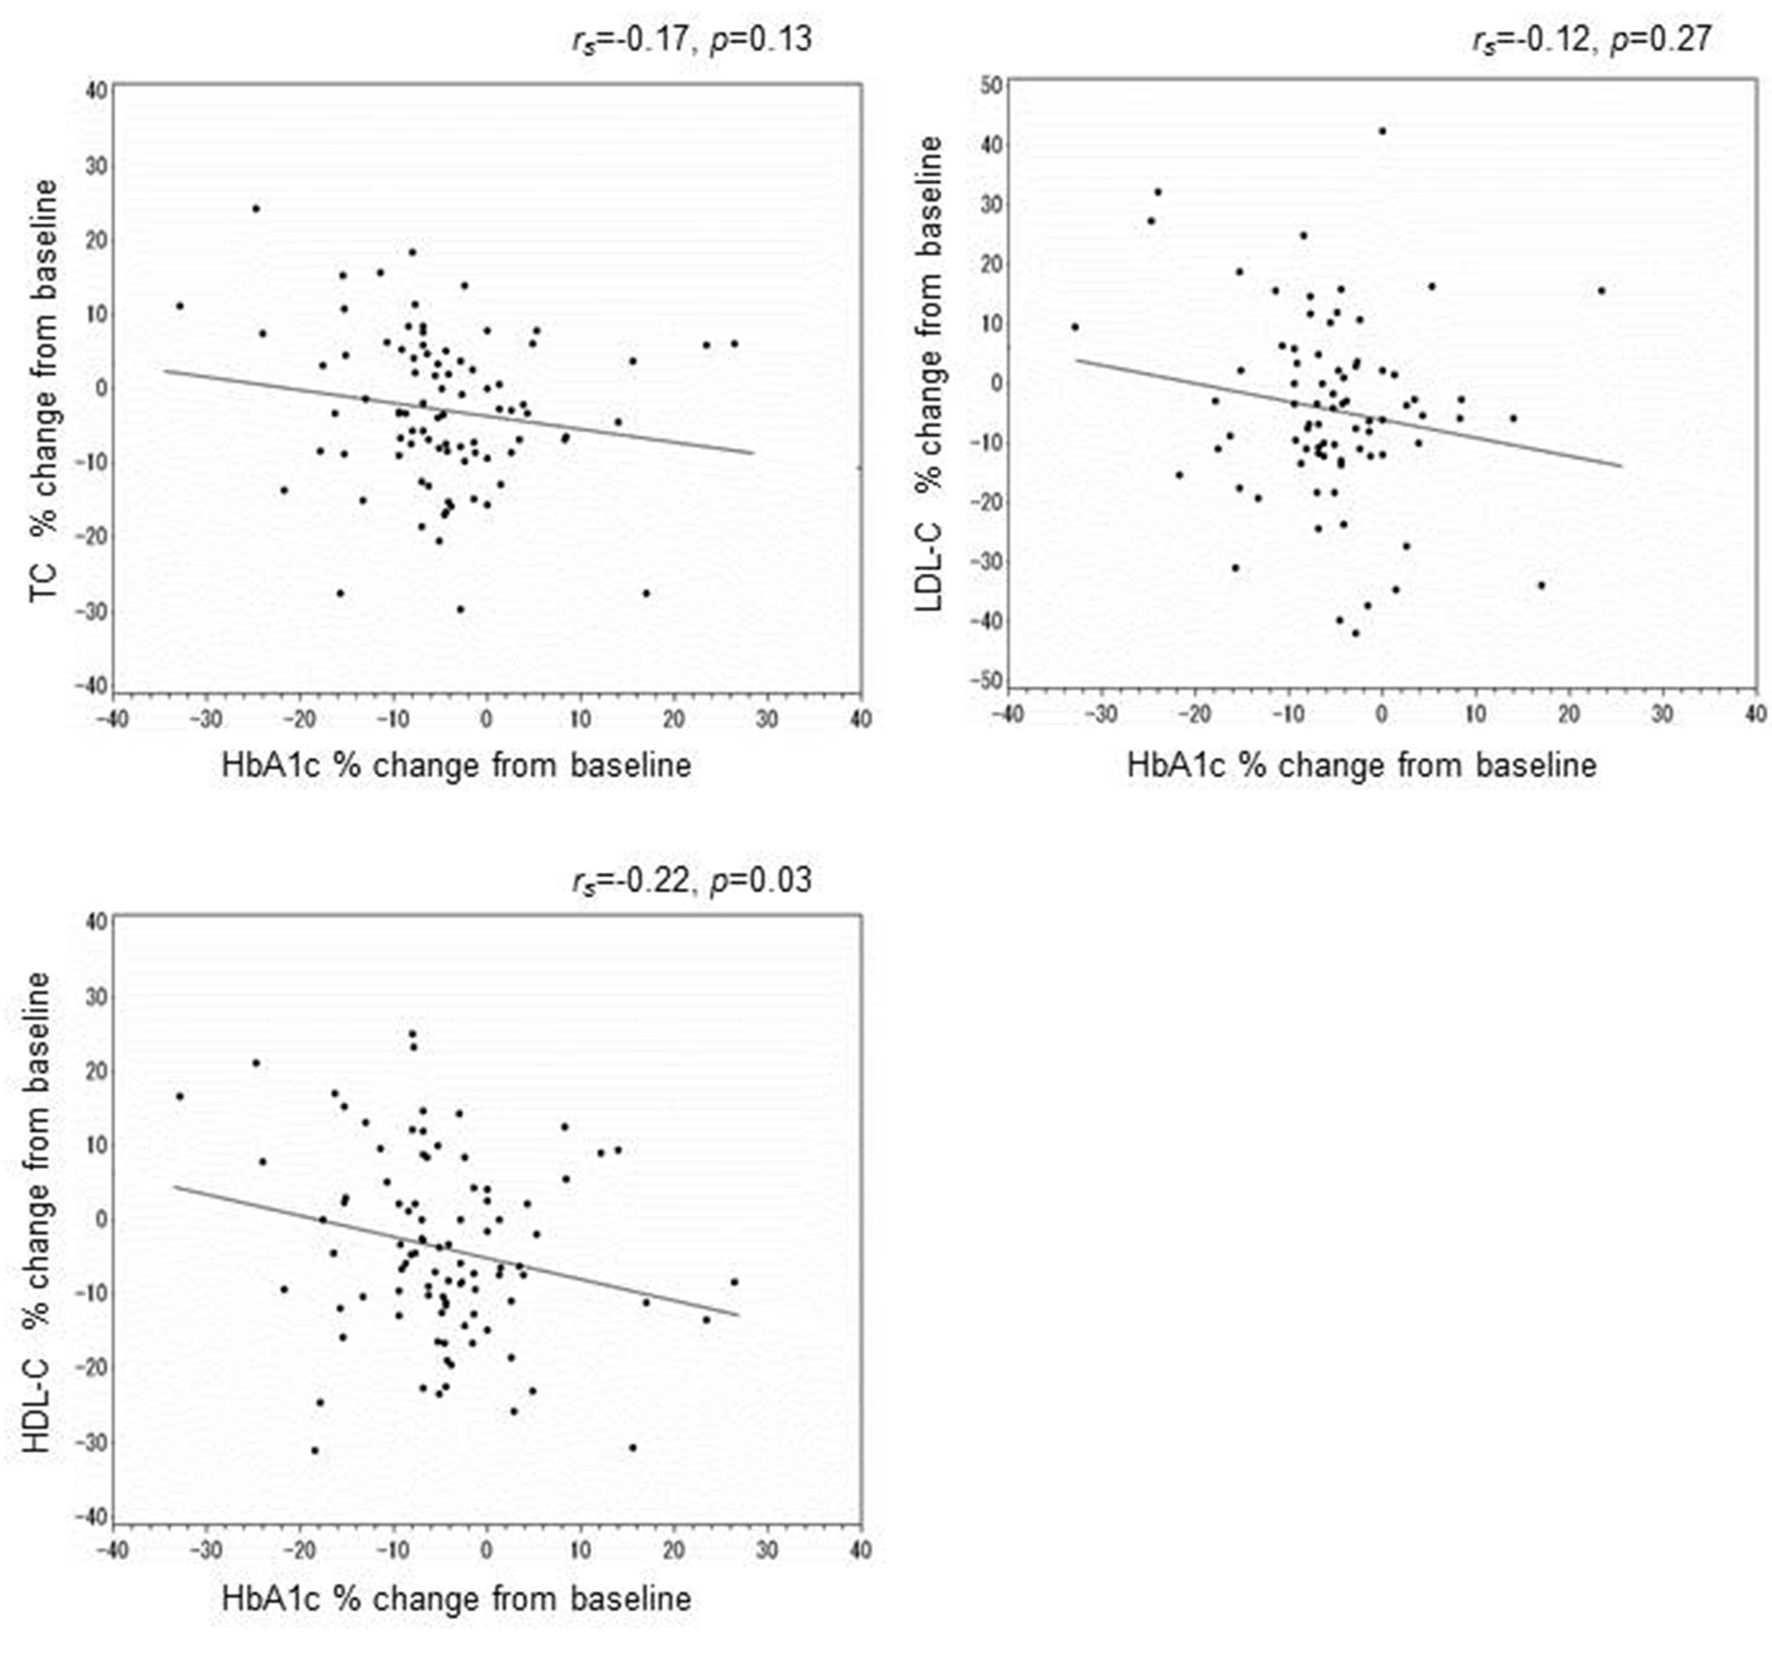
Figure 1. Correlation between the percent change in HbA1c and that in TC, LDL-C, or HDL-C at 24 weeks.
| Journal of Clinical Medicine Research, ISSN 1918-3003 print, 1918-3011 online, Open Access |
| Article copyright, the authors; Journal compilation copyright, J Clin Med Res and Elmer Press Inc |
| Journal website http://www.jocmr.org |
Original Article
Volume 10, Number 8, August 2018, pages 648-656
Effect of Anagliptin on Glycemic and Lipid Profile in Patients With Type 2 Diabetes Mellitus
Figure
Tables
| Baseline | |
|---|---|
| N | 95 |
| Age (years) | 63.7 ± 11.7 |
| Age ≥ 60 | 67 (70.5%) |
| Sex, M/F | 59/36 |
| Weight (kg) | 66.3 ± 13.3 |
| BMI (kg/m2) | 25.4 ± 4.3 |
| TC (mg/dL) | 195.1 ± 41.6 |
| LDL-C (mg/dL) | 110.6 ± 37.1 |
| HDL-C (mg/dL) | 55.5 ± 13.8 |
| TG (mg/dL) | 148.1 ± 90.9 |
| Glucose (mg/dL) | 158.5 ± 41.0 |
| HbA1c (NGSP) (%) | 7.4 ± 0.7 |
| Neuropathy | 20 (21.0%) |
| Retinopathy | 15 (15.8%) |
| Nephropathy | 23 (24.2%) |
| Female | Male | P-value | |
|---|---|---|---|
| *P < 0.05. | |||
| N | 36 | 59 | |
| Age (years) | 63.3 ± 12.5 | 64.0 ± 11.3 | 0.77 |
| Age ≥ 60 | 25 (69.4 %) | 42 (71.2 %) | |
| Weight (kg) | 62.9 ± 11.5 | 68.4 ± 13.9 | 0.049* |
| BMI (kg/m2) | 26.3 ± 4.3 | 24.9 ± 4.2 | 0.11 |
| TC (mg/dL) | 202.8 ± 43.7 | 190.1 ± 39.8 | 0.16 |
| LDL-C (mg/dL) | 114.5 ± 39.2 | 107.9 ± 35.7 | 0.42 |
| HDL-C (mg/dL) | 60.1 ±13.1 | 52.7 ± 13.5 | 0.010* |
| TG (mg/dL) | 140.9 ± 67.2 | 152.6 ± 103.3 | 0.55 |
| Glucose (mg/dL) | 148.8 ± 29.7 | 164.3 ± 45.7 | 0.076 |
| HbA1c (NGSP) (%) | 7.5 ± 0.6 | 7.3 ±0.7 | 0.39 |
| Cr (mg/dL) | 0.66 ± 0.12 | 0.86 ± 0.14 | < 0.001* |
| eGFR (mL/min/1.73m2) | 72.3 ± 14.6 | 72.3 ± 13.7 | 1.00 |
| Baseline | 12 weeks | 24 weeks | |||||||
|---|---|---|---|---|---|---|---|---|---|
| Mean ± SD | Mean ± SD | % Change from baseline (mean (95% CL)) | Amount of change (mean ± SD) | P-value | Mean ± SD | % Change from baseline (mean (95% CL)) | Amount of change (mean ± SD) | P-value | |
| *P < 0.05. | |||||||||
| Weight (kg) | 66.3 ± 13.3 | 66.1 ± 13.5 | -1 (-1, -0.2) | -0.5 ± 1.8 | 0.016* | 66.7 ± 13.8 | 0 (-1, 0.4) | -0.2 ± 2.3 | 0.35 |
| TC (mg/dL) | 195.1 ± 41.6 | 188.2 ± 38.3 | -3 (-6, -0.1) | -7.6 ± 27.9 | 0.012* | 189.4 ± 36.5 | -3 (-5, -0.5) | -7.4 ± 22.1 | 0.0029* |
| LDL-C (mg/dL) | 110.6 ± 37.1 | 105.4 ± 34.2 | -2 (-7, 3.4) | -6.0 ± 28.7 | 0.06 | 104.7 ± 31.2 | -3 (-7, 0.5) | -7.3 ± 19.6 | 0.0014* |
| HDL-C (mg/dL) | 55.5 ± 13.8 | 55.2 ± 23.9 | 1 (-8, 11.3) | -0.4 ± 22.9 | 0.88 | 52.8 ± 14.0 | -4 (-6, -1.4) | -2.5 ± 7.0 | < 0.001* |
| TG (mg/dL) | 148.1 ± 90.9 | 156.4 ± 110.8 | 13 (2, 23.5) | 7.4 ± 80.5 | 0.38 | 171.6 ± 150.7 | 23 (3, 41.7) | 21.1 ± 129.9 | 0.13 |
| Glucose (mg/dL) | 158.5 ± 41.0 | 144.4 ± 37.8 | -6 (-11, -1.3) | -14.2 ± 40.9 | 0.0012* | 140.9 ± 36.9 | -7 (-13, -0.9) | -17.9 ± 52.0 | 0.0015* |
| HbA1c (%) | 7.4 ± 0.7 | 7.0 ± 0.8 | -5 (-6, -3) | -0.3 ± 0.6 | < 0.001* | 7.0 ± 0.9 | -5 (-7, -2.8) | -0.4 ± 0.8 | < 0.001* |
| N | TC | P-value | LDL-C | P-value | HDL-C | P-value | TG | P-value | Glucose | P-value | HbA1c | P-value | |
|---|---|---|---|---|---|---|---|---|---|---|---|---|---|
| *P < 0.05. | |||||||||||||
| Age | |||||||||||||
| < 60 | 26 | -2.9 ± 7.3 | 0.93 | -5.5 ± 13.4 | 0.52 | -6.3 ± 11.0 | 0.21 | 55.8 ± 134.3 | 0.1 | -2.8 ± 33.7 | 0.45 | -0.3 ± 10.3 | 0.01* |
| ≥ 60 | 65 | -2.7 ± 11.3 | -2.9 ± 19.0 | -2.9 ± 12.6 | 9.1 ± 62.9 | -8.5 ± 26.2 | -6.5 ± 8.7 | ||||||
| Sex | |||||||||||||
| Female | 33 | -5.2 ± 10.8 | 0.09 | -7.6 ± 17.4 | 0.083 | -3.1 ± 12.3 | 0.65 | 11.2 ± 64.9 | 0.32 | -3.0 ± 22.5 | 0.30 | -7.8 ± 8.0 | 0.013* |
| Male | 58 | -1.2 ± 9.8 | -0.6 ± 17.6 | -4.3 ± 12.3 | 29.2 ± 103.4 | -9.0 ± 31.2 | -3.0 ± 10.0 | ||||||
| BMI | |||||||||||||
| <25 | 44 | -3.5 ± 10.7 | 0.53 | -4.4 ± 15.8 | 0.63 | -3.9 ± 11.3 | 0.97 | 13.6 ± 65.1 | 0.36 | -8.1 ± 24.0 | 0.69 | -5.6 ± 7.6 | 0.43 |
| ≥25 kg/m2 | 47 | -2.1 ± 10.0 | -2.4 ± 20.0 | -3.9 ± 13.1 | 31.2 ± 110.7 | -5.7 ± 32.3 | -4.0 ± 11.1 | ||||||
| Baseline | |||||||||||||
| TC (< 200 mg/dL) | 48 | 0.7 ± 9.7 | < 0.001* | 2.6 ± 18.2 | < 0.001* | -1.1 ± 12.8 | 0.017* | 15.0 ± 66.9 | 0.43 | -8.1 ± 23.5 | 0.68 | -6.1 ± 9.2 | 0.20 |
| TC (≥ 200 mg/dL) | 39 | -7.1 ± 9.5 | -12.0 ± 13.3 | -7.3 ± 10.6 | 32.1 ± 118.6 | -5.4 ± 34.1 | -3.5 ± 9.7 | ||||||
| LDL-C (< 120 mg/dL) | 49 | -0.8 ± 10.0 | 0.02* | 1.4 ± 18.6 | 0.001* | -2.5 ± 12.7 | 0.17 | 10.3 ± 51.7 | 0.18 | -5.4 ± 30.4 | 0.70 | -5.0 ± 10.2 | 0.81 |
| LDL-C (≥ 120 mg/dL) | 35 | -6.1 ± 10.1 | -10.7 ± 13.7 | -6.1 ± 11.2 | 42.3 ± 130.9 | -7.9 ± 27.0 | -4.5 ± 8.5 | ||||||
| HDL-C (< 40 mg/dL) | 11 | 3.7 ± 11.1 | 0.056 | 17.2 ± 26.4 | 0.063 | 6.3 ± 11.5 | 0.008* | 5.5 ± 75.7 | 0.47 | 1.4 ± 41.1 | 0.48 | -5.5 ± 16.7 | 0.87 |
| HDL-C(≥ 40 mg/dL) | 80 | -3.7 ± 9.9 | -5.5 ± 15.5 | -5.3 ± 11.7 | 24.7 ± 93.1 | -8.0 ± 26.4 | -4.7 ± 8.3 | ||||||
| TG (< 150 mg/dL) | 55 | -2.5 ± 10.1 | 0.74 | -5.3 ± 14.3 | 0.3 | -5.4 ± 13.0 | 0.18 | 36.3 ± 106.6 | 0.04* | -9.3 ± 27.9 | 0.32 | -5.6 ± 10.0 | 0.25 |
| TG (≥ 150 mg/dL) | 35 | -3.3 ± 11.0 | -0.3 ± 22.7 | -2.0 ± 10.7 | 1.0 ± 54.2 | -3.0 ± 29.6 | -3.2 ± 8.7 | ||||||
| Lipid treatment | |||||||||||||
| No | 44 | -4.6 ± 10.2 | 0.13 | -7.1 ± 15.2 | 0.084 | -4.0 ± 11.8 | 0.92 | 25.9 ± 105.5 | 0.74 | -12.1 ± 24.6 | 0.084 | -5.2 ± 10.8 | 0.69 |
| Yes | 47 | -1.2 ± 10.3 | -0.2 ± 19.4 | -3.8 ± 12.7 | 19.4 ± 76.1 | -1.8 ± 31.1 | -4.4 ± 8.3 | ||||||
| Statin | |||||||||||||
| No | 48 | -3.2 ± 10.7 | 0.71 | -6.6 ± 15.3 | 0.12 | -3.8 ± 11.8 | 0.95 | 30.4 ± 105.9 | 0.38 | -9.7 ± 30.2 | 0.31 | -4.9 ± 11.5 | 0.88 |
| Yes | 43 | -2.3 ± 10.0 | -0.3 ± 19.7 | -4.0 ± 12.9 | 13.7 ± 71.1 | -3.6 ± 26.3 | -4.6 ± 6.9 | ||||||
| Univariate | Multivariate | ||||||
|---|---|---|---|---|---|---|---|
| Regression coefficient (95% CI) | P-value | Regression coefficient (95% CI) | P-value | ||||
| *P < 0.05. | |||||||
| % change in TC at 24 weeks | |||||||
| Age | ≥ 60 | 0.2 | (-4.8, 5.2) | 0.94 | -1.7 | (-6.4, 3.0) | 0.47 |
| Sex | Male | 4.0 | (-0.4, 8.4) | 0.075 | 3.9 | (-0.1, 8.0) | 0.055 |
| BMI | ≥ 25 kg/m2 | 1.4 | (-2.9, 5.8) | 0.52 | 2.4 | (-1.9, 6.6) | 0.27 |
| Baseline TC | ≥ 200 mg/dL | -7.9 | (-11.9, -3.8) | < 0.001* | -10.1 | (-15.7, -4.6) | < 0.001* |
| Baseline LDL-C | ≥ 120 mg/dL | -5.3 | (-9.7, -1.0) | 0.016* | 1.8 | (-3.8, 7.4) | 0.53 |
| Baseline HDL-C | ≥ 40 mg/dL | -7.4 | (-13.8, -1.1) | 0.021* | -3.7 | (-10.5, 3.2) | 0.29 |
| Baseline TG | ≥ 150 mg/dL | -0.8 | (-5.4, 3.7) | 0.73 | |||
| Lipid therapy | Yes | 3.4 | (-0.9, 7.7) | 0.12 | |||
| Statin | Yes | 0.8 | (-3.5, 5.2) | 0.71 | |||
| % change in LDL-C at 24 weeks | |||||||
| Age | ≥ 60 | 2.6 | (-6.5, 11.7) | 0.58 | -1.2 | (-9.3, 7.0) | 0.78 |
| Sex | Male | 7.0 | (-0.7, 14.8) | 0.075 | 7.2 | (0.3, 14.1) | 0.04* |
| BMI | ≥ 25 kg/m2 | 2.0 | (-5.8, 9.8) | 0.62 | 3.1 | (-4.1, 10.3) | 0.40 |
| Baseline TC | ≥ 200 mg/dL | -14.6 | (-21.8, -7.4) | < 0.001* | -9.3 | (-19.2, 0.6) | 0.065 |
| Baseline LDL-C | ≥ 120 mg/dL | -12.1 | (-19.5, -4.6) | 0.002* | -3.9 | (-13.7, 5.9) | 0.44 |
| Baseline HDL-C | ≥ 40 mg/dL | -22.7 | (-35.5, -10.0) | < 0.001* | -16.7 | (-29.0, -4.4) | 0.008* |
| Baseline TG | ≥ 150 mg/dL | 5.0 | (-3.1, 13.0) | 0.23 | |||
| Lipid therapy | Yes | 6.9 | (-0.8, 14.5) | 0.078 | |||
| Statin | Yes | 6.2 | (-1.4, 13.9) | 0.11 | |||
| % change in HDL-C at 24 weeks | |||||||
| Age | ≥ 60 | 3.4 | (-2.1, 8.9) | 0.22 | -1.2 | (-9.3, 7.0) | 0.78 |
| Sex | Male | -1.2 | (-6.4, 4.0) | 0.65 | 7.2 | (0.3, 14.1) | 0.04* |
| BMI | ≥ 25 kg/m2 | -0.1 | (-5.1, 4.9) | 0.97 | 3.1 | (-4.1, 10.3) | 0.40 |
| Baseline TC | ≥ 200 mg/dL | -6.1 | (-11.1, -1.2) | 0.015* | -9.3 | (-19.2, 0.6) | 0.065 |
| Baseline LDL-C | ≥ 120 mg/dL | -3.7 | (-8.9, 1.5) | 0.17 | -3.9 | (-13.7, 5.9) | 0.44 |
| Baseline HDL-C | ≥ 40 mg/dL | -11.6 | (-18.9, -4.3) | 0.002* | -16.7 | (-29, -4.4) | 0.008* |
| Baseline TG | ≥ 150 mg/dL | 3.4 | (-1.7, 8.5) | 0.19 | |||
| Lipid therapy | Yes | 0.3 | (-4.7, 5.3) | 0.92 | |||
| Statin | Yes | -0.2 | (-5.2, 4.8) | 0.95 | |||