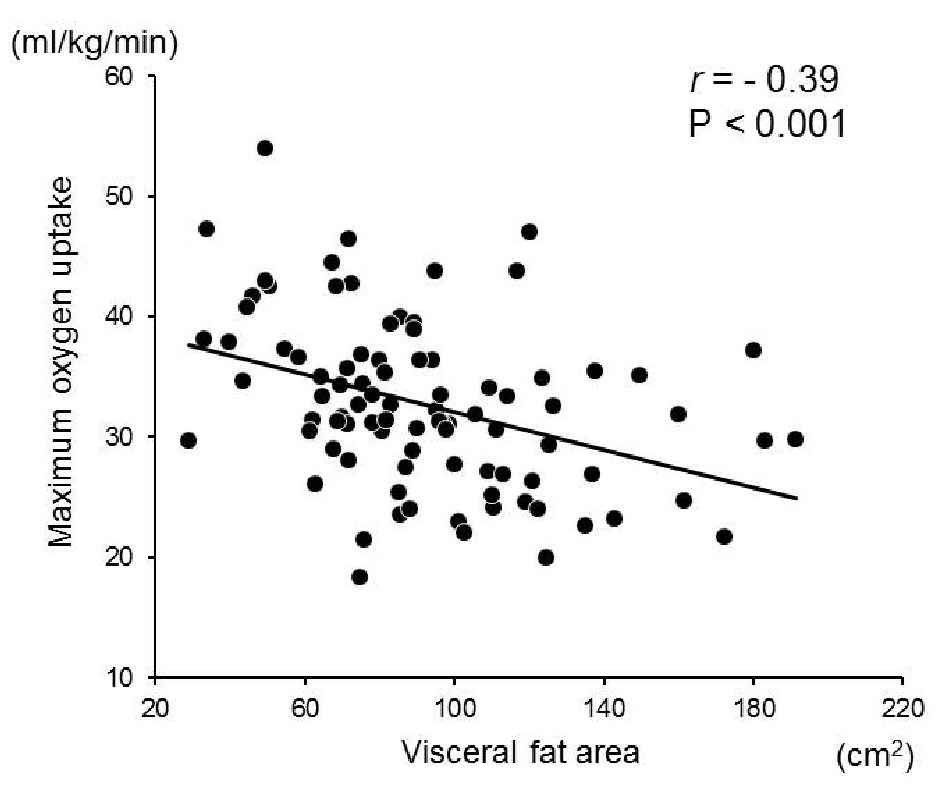
Figure 1. Correlation between the visceral fat area and maximum oxygen uptake. A significant inverse relationship was observed between the visceral fat area and maximum oxygen uptake in the non-obese subjects (r = -0.37, P < 0.01, n = 74).
| Journal of Clinical Medicine Research, ISSN 1918-3003 print, 1918-3011 online, Open Access |
| Article copyright, the authors; Journal compilation copyright, J Clin Med Res and Elmer Press Inc |
| Journal website http://www.jocmr.org |
Original Article
Volume 10, Number 8, August 2018, pages 630-635
Association Between Visceral Fat Accumulation and Exercise Tolerance in Non-Obese Subjects Without Diabetes
Figure
Tables
| Group A (n = 38) | Group B (n = 36) | P | |
|---|---|---|---|
| Data are presented as the mean value ± SD. BMI: body mass index; LDL: low-density lipoprotein; HDL: high-density lipoprotein; HOMA-IR: homeostasis model assessment-insulin resistance; HMW adiponectin: high molecular weight adiponectin; AST: aspartate transaminase; ALT: alanine aminotransferase; GT: glutamyltranspeptidase. | |||
| Age, yrs | 42.2 ± 4.2 | 44.0 ± 3.4 | NS |
| BMI, kg/m2 | 22.9 ± 1.0 | 24.0 ± 0.5 | < 0.01 |
| Abdominal circumference, cm | 81.1 ± 5.2 | 85.8 ± 4.5 | < 0.01 |
| Visceral fat area, cm2 | 77.5 ± 30.2 | 99.1 ± 23.6 | < 0.01 |
| Systolic blood pressure, mm Hg | 118 ± 7 | 133 ± 13 | < 0.01 |
| LDL-cholesterol, mg/dL | 110 ± 23 | 125 ± 28 | < 0.05 |
| HDL-cholesterol, mg/dL | 64 ± 12 | 55 ± 14 | < 0.01 |
| Triglyceride, mg/dL | 74 ± 29 | 179 ± 100 | < 0.01 |
| Fasting glucose, mg/dL | 93 ± 6 | 97 ± 8 | < 0.05 |
| Fasting insulin, µU/dL | 4.2 ± 1.9 | 6.2 ± 3.2 | < 0.01 |
| HOMA-IR | 0.9 ± 0.4 | 1.5 ± 0.8 | < 0.01 |
| Hemoglobin A1c, % | 4.8 ± 0.2 | 4.9 ± 0.3 | NS |
| HMW adiponectin, µg/mL | 1.7 ± 1.2 | 0.9 ± 0.7 | < 0.01 |
| AST, IU/L | 20 ± 5 | 26 ± 6 | < 0.01 |
| ALT, IU/L | 20 ± 7 | 33 ± 19 | < 0.01 |
| γ-GT, IU/L | 34 ± 26 | 59 ± 50 | < 0.01 |
| Creatinine, mg/dL | 0.80 ± 0.09 | 0.80 ± 0.08 | NS |
| Metabolic syndrome (%) | 0 (0) | 8 (22) | < 0.01 |
| Group A (n = 38) | Group B (n = 36) | P | |
|---|---|---|---|
| Data are presented as the mean value ± SD. HR: heart rate; BP: blood pressure. | |||
| HR at rest, bpm | 74 ± 13 | 79 ± 11 | < 0.05 |
| HR at maximal exercise, bpm | 173 ± 14 | 169 ± 15 | NS |
| HR at 1 min after exercise, bpm | 144 ± 14 | 139 ± 14 | NS |
| HR at 3 min after exercise, bpm | 121 ± 12 | 114 ± 14 | NS |
| HR at 5 min after exercise, bpm | 108 ± 13 | 100 ± 21 | NS |
| BP at rest, mm Hg | 124 ± 11 | 136 ± 10 | < 0.01 |
| BP at maximal exercise, mm Hg | 205 ± 21 | 223 ± 22 | < 0.01 |
| BP at 1 min after exercise, mm Hg | 172 ± 22 | 178 ± 34 | NS |
| BP at 3 min after exercise, mm Hg | 165 ± 13 | 177 ± 37 | NS |
| BP at 5 min after exercise, mm Hg | 137 ± 19 | 147 ± 26 | NS |
| Anaerobic threshold, mL/kg/min | 20.0 ± 6.1 | 16.3 ± 3.8 | < 0.01 |
| Maximal oxygen uptake, mL/kg/min | 35.4 ± 7.1 | 30.5 ± 5.7 | < 0.01 |
| β | P | |
|---|---|---|
| HDL: high-density lipoprotein; LDL: low-density lipoprotein; HOMA-IR: homeostasis model assessment-nsulin resistance; ALT: alanine aminotransferase; HMW adiponectin: high molecular weight adiponectin. | ||
| Body mass index, kg/m2 | 0.01 | NS |
| Visceral fat area, cm2 | -0.26 | 0.04 |
| Triglyceride, mg/dL | -0.22 | NS |
| HDL-cholesterol, mg/dL | 0.08 | NS |
| LDL-cholesterol, mg/dL | -0.08 | NS |
| HOMA-IR | -0.01 | NS |
| ALT, IU/L | -0.01 | NS |
| HMW adiponectin, µg/mL | 0.02 | NS |
| β | P | |
|---|---|---|
| Body mass index, kg/m2 | 0.02 | NS |
| Abdominal circumference, cm2 | -0.21 | NS |
| Triglyceride, mg/dL | -0.23 | NS |
| HDL-cholesterol, mg/dL | 0.08 | NS |
| LDL-cholesterol, mg/dL | -0.08 | NS |
| HOMA-IR | -0.01 | NS |
| ALT, IU/L | -0.02 | NS |
| HMW adiponectin, µg/mL | 0.04 | NS |