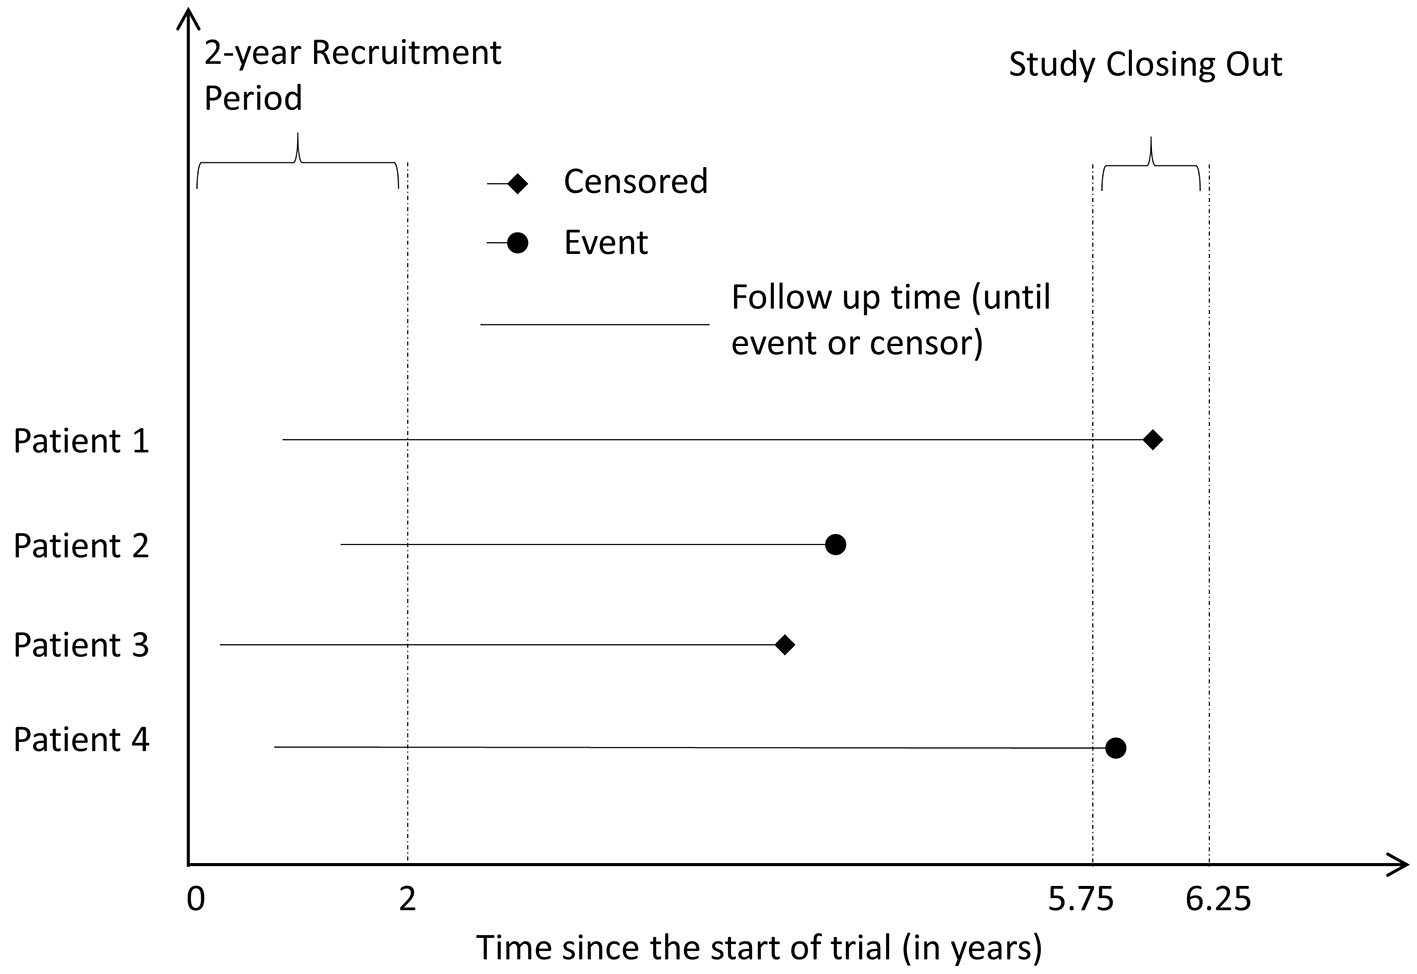
Figure 1. Illustrative example of the simulation.
| Journal of Clinical Medicine Research, ISSN 1918-3003 print, 1918-3011 online, Open Access |
| Article copyright, the authors; Journal compilation copyright, J Clin Med Res and Elmer Press Inc |
| Journal website http://www.jocmr.org |
Original Article
Volume 10, Number 5, May 2018, pages 376-383
The Impact of the Underlying Risk in Control Group and Effect Measures in Non-Inferiority Trials With Time-to-Event Data: A Simulation Study
Figures
Tables
| Non-inferiority margin | Underlying risk in control group | |||
|---|---|---|---|---|
| < 10% | 10-25% | 25-75% | > 75% | |
| The probability of rejecting the null hypothesis is the same as the statistical power in our simulations. | ||||
| True hazard ratio = 1 | ||||
| HR = 1.2 | 0.067 | 0.152 | 0.323 | 0.513 |
| HR = 1.35 | 0.131 | 0.323 | 0.684 | 0.903 |
| HR = 1.5 | 0.224 | 0.527 | 0.890 | 0.993 |
| True hazard ratio = 0.95 | ||||
| HR = 1.2 | 0.094 | 0.200 | 0.482 | 0.716 |
| HR = 1.35 | 0.194 | 0.413 | 0.790 | 0.968 |
| HR = 1.5 | 0.286 | 0.607 | 0.935 | 0.999 |
| True hazard ratio = 1.05 | ||||
| HR = 1.2 | 0.056 | 0.112 | 0.198 | 0.305 |
| HR = 1.35 | 0.104 | 0.252 | 0.544 | 0.771 |
| HR = 1.5 | 0.171 | 0.425 | 0.821 | 0.970 |
| Non-inferiority margin | Underlying risk in control group | |||
|---|---|---|---|---|
| < 10% | 10-25% | 25-75% | > 75% | |
| DTKME: difference in two Kaplan-Meier estimators at follow-up of 5 years. The probability of rejecting the null hypothesis is the same as the statistical power in our simulations. | ||||
| True hazard ratio = 1 | ||||
| DTKME = 2.5% | 0.221 | 0.117 | 0.077 | 0.123 |
| DTKME = 5% | 0.656 | 0.334 | 0.199 | 0.352 |
| DTKME = 10% | 0.981 | 0.831 | 0.607 | 0.842 |
| DTKME = 15% | 1.000 | 0.990 | 0.922 | 0.984 |
| True hazard ratio = 0.95 | ||||
| DTKME = 2.5% | 0.275 | 0.154 | 0.151 | 0.229 |
| DTKME = 5% | 0.699 | 0.400 | 0.319 | 0.502 |
| DTKME = 10% | 0.995 | 0.885 | 0.750 | 0.920 |
| DTKME = 15% | 1.000 | 0.993 | 0.960 | 1.000 |
| True hazard ratio = 1.05 | ||||
| DTKME = 2.5% | 0.190 | 0.086 | 0.039 | 0.058 |
| DTKME = 5% | 0.551 | 0.257 | 0.120 | 0.228 |
| DTKME = 10% | 0.977 | 0.750 | 0.468 | 0.735 |
| DTKME = 15% | 1.000 | 0.977 | 0.858 | 0.972 |