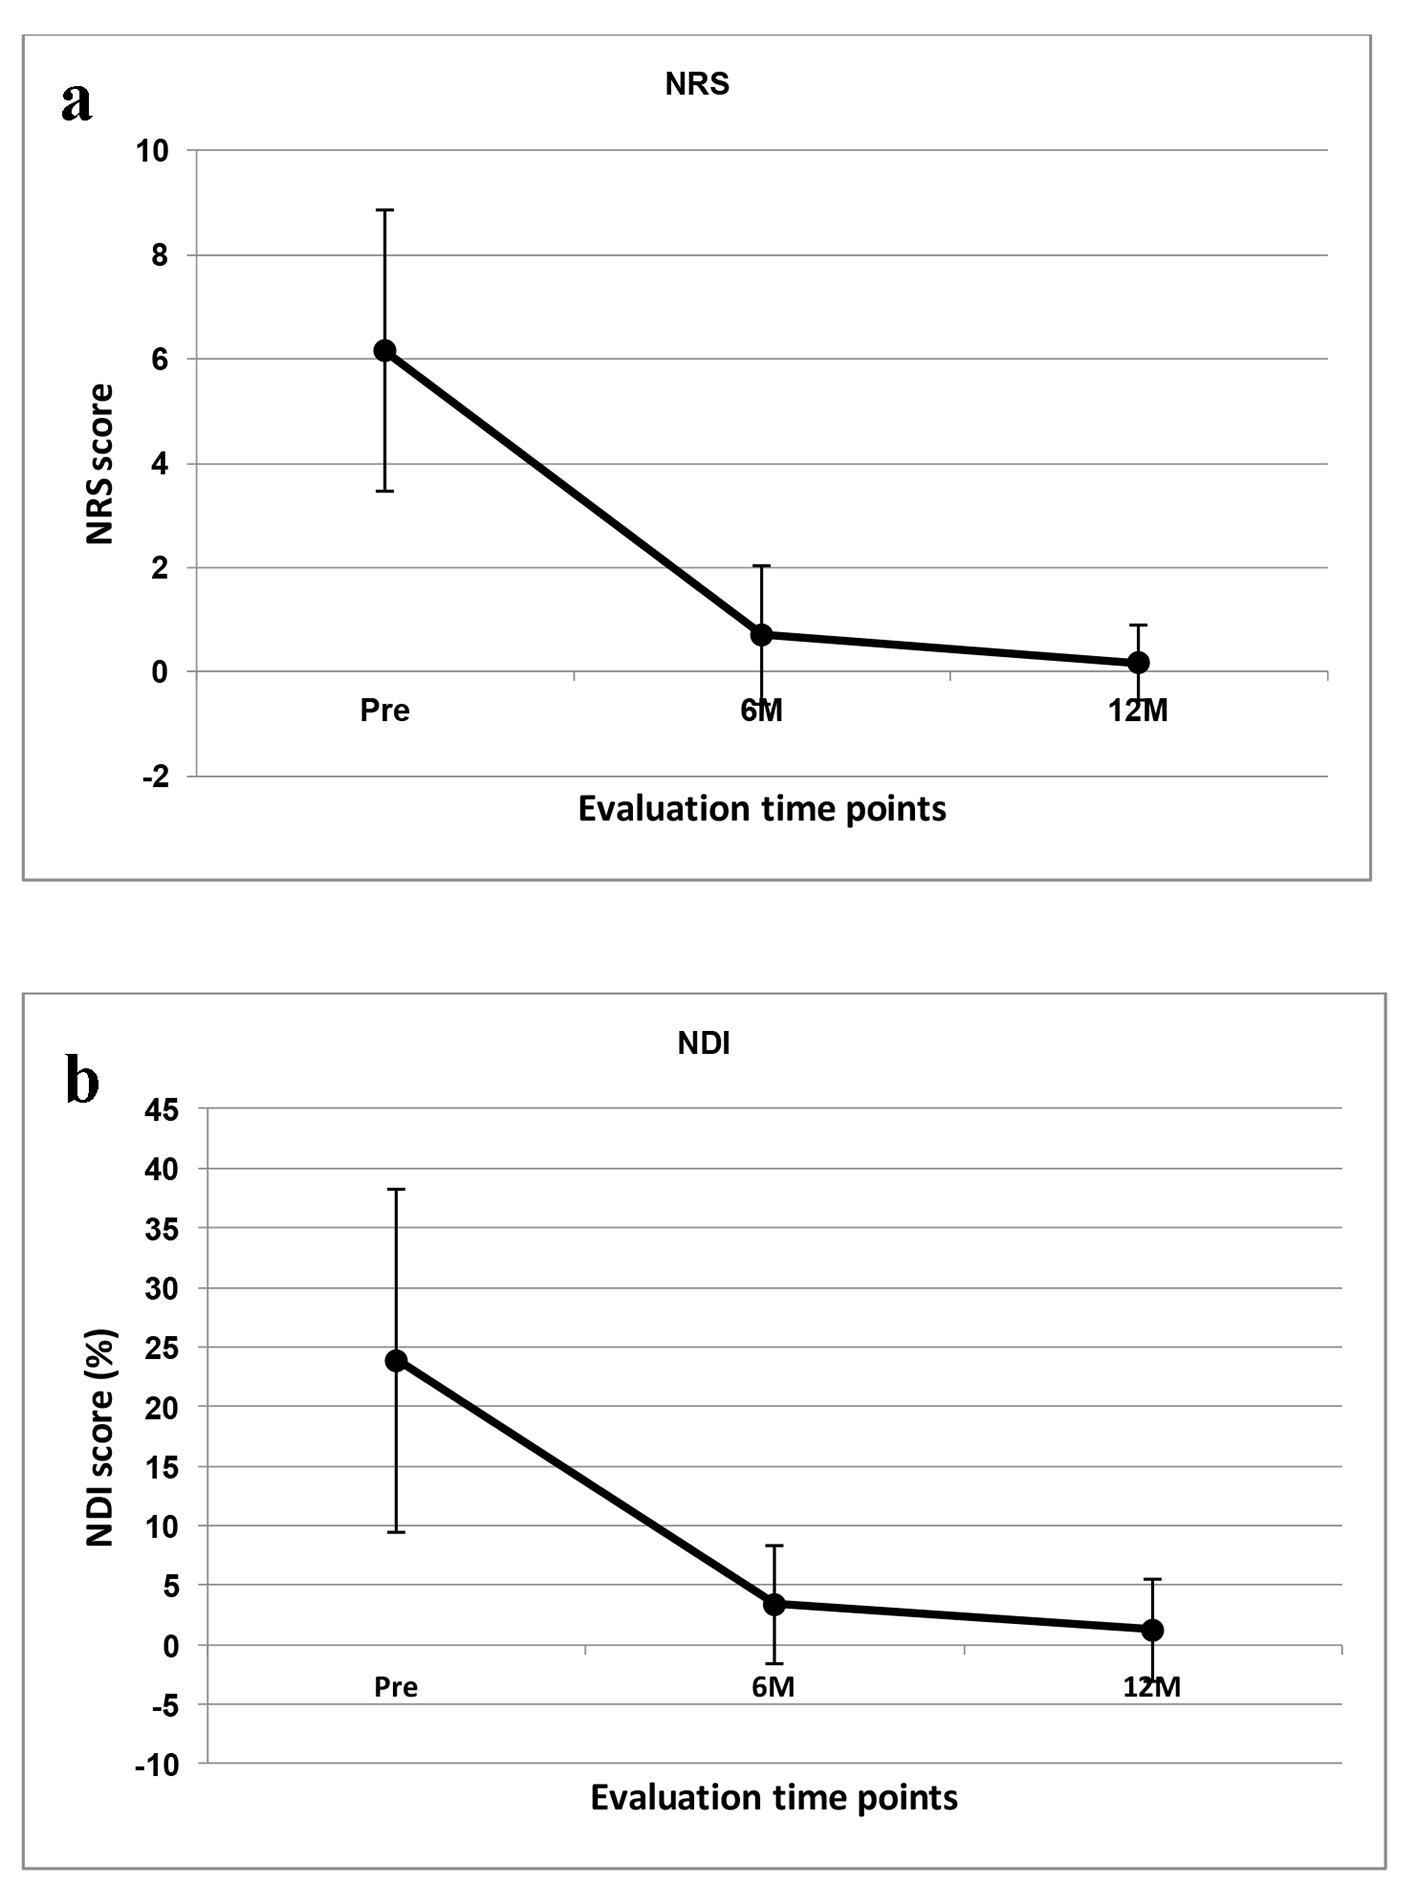
Figure 1. Line graphs illustrating: (a) the pain NRS mean scores and (b) the NDI mean scores preoperatively and then at 6- and 12-month time points. There was significant difference between time points for both instruments.
| Journal of Clinical Medicine Research, ISSN 1918-3003 print, 1918-3011 online, Open Access |
| Article copyright, the authors; Journal compilation copyright, J Clin Med Res and Elmer Press Inc |
| Journal website http://www.jocmr.org |
Original Article
Volume 10, Number 3, March 2018, pages 268-276
Correlation of Clinical and Radiological Outcome After Anterior Cervical Discectomy and Fusion With a Polyetheretherketone Cage
Figures
Tables
| Evaluation method | Preoperative | Postoperative (day of hospital discharge) | 6-month follow-up | 12-month follow-up |
|---|---|---|---|---|
| Lateral radiographs in neutral position | √ | √ | √ | √ |
| Full flexion/extension lateral radiographs | √ | √ | √ | |
| Cervical lordosis estimation (Cobb angle) | √ | √ | √ | √ |
| Cervical ROM calculation | √ | √ | √ | |
| NRS | √ | √ | √ | √ |
| NDI | √ | √ | √ |
| Inclusion criteria |
| Adult patients (age ≥ 18) |
| Symptomatic single- or two-level disc disease between C3 and C7/neck or arm pain (radicular) and/or a functional/neurological deficit/at least one of the following conditions confirmed by CT or MRI: herniated nucleus pulposus, spondylosis, and/or loss of disc height |
| Mentally, psychologically, and physically able to comply this protocol, including adherence to follow-up schedules and requirements, and filling out of necessary paperwork |
| Conservative treatment failed for at least 3 months (for only pain-related pathology) |
| Exclusion criteria |
| Previous cervical operations/cervical spine tumors/infections of the cervical spine/cervical injuries |
| Mental abnormalities |
| Characteristic | No. of patients/value (%) |
|---|---|
| No. of patients | 74 |
| Male/female ratio | 36:38 |
| Age (years) | |
| Mean | 50.09 ± 13.54 |
| Range | 28 - 86 |
| Body mass index (BMI) | |
| Mean | 27.82 ± 4.73 |
| Range | 20.3 - 42.0 |
| No. of smokers | 37 (50) |
| Radiculopathy/myelopathy ratio | 36:38 |
| Single-level ACDF | 66 (89.19) |
| Two-level ACDF | 8 (10.81) |
| ACDF (disc level) | |
| C3-4 | 14 (17.07) |
| C4-5 | 16 (19.51) |
| C5-6 | 38 (46.34) |
| C6-7 | 14 (17.07) |
| Duration of postoperative brace (days) | |
| Mean | 34.44 ± 17.56 |
| Range | 30 - 120 |
| Subgroups | NRS | NDI | |||||
|---|---|---|---|---|---|---|---|
| Preoperative | Postoperative | 6 M | 12 M | Preoperative | 6 M | 12 M | |
| M indicates months. NDI (%). | |||||||
| Smokers (n = 37) | 6.32 ± 2.86 | 2.38 ± 1.74 | 0.79 ± 1.52 | 0.19 ± 0.74 | 23.89 ± 12.54 | 2.35 ± 3.12 | 0.57 ± 1.72 |
| Non-smokers (n = 37) | 6.00 ± 2.59 | 2.41 ± 1.54 | 0.62 ± 1.14 | 0.16 ± 0.73 | 24.08 ± 16.35 | 4.54 ± 6.18 | 1.97 ± 5.66 |
| P value | 0.611 | 0.944 | 0.582 | 0.874 | 0.956 | 0.058 | 0.156 |
| Myelopathy (n = 38) | 5.79 ± 2.91 | 2.16 ± 1.42 | 0.51 ± 1.03 | 0.03 ± 0.16 | 23.32 ± 15.82 | 3.76 ± 6.13 | 1.63 ± 5.27 |
| Radiculopathy (n = 36) | 6.57 ± 2.50 | 2.71 ± 1.77 | 0.94 ± 1.61 | 0.34 ± 1.03 | 24.46 ± 13.19 | 3.20 ± 3.44 | 0.91 ± 2.77 |
| P value | 0.225 | 0.143 | 0.181 | 0.080 | 0.740 | 0.634 | 0.475 |
| Single-level fusion (n = 66) | 6.33 ± 2.75 | 2.44 ± 1.67 | 0.79 ± 1.39 | 0.20 ± 0.77 | 23.29 ± 14.27 | 3.38 ± 4.47 | 1.12 ± 3.79 |
| Two-level fusion (n = 8) | 4.75 ± 2.05 | 2.00 ± 1.19 | 0.00 ± 0.00 | 0.00 ± 0.00 | 29.75 ± 15.80 | 4.00 ± 8.55 | 2.50 ± 7.07 |
| P value | 0.120 | 0.475 | 0.095 | 0.474 | 0.235 | 0.845 | 0.386 |
| Outcome | Preoperative | Postoperative | 6 M | 12 M |
|---|---|---|---|---|
| M indicates months. NDI (%). Cobb angle and ROM (°). Min-max in brackets. | ||||
| NRS (n = 74) | 6.16 ± 2.7 (0 - 10) | 2.40 ± 1.62 (0 - 6) | 0.70 ± 1.33 (0 - 6) | 0.17 ± 0.72 (0 - 4) |
| NDI (n = 74) | 23.88 ± 14.4 (0 - 74) | 3.40 ± 4.96 (0 - 25) | 1.25 ± 4.29 (0 - 25) | |
| Cobb angle (n = 74) | 14.7 ± 9.36 (-22.0 - 42.0) | 14.88 ± 8.36 (2.0 - 43.0) | 12.0 ± 9.56 (-9.0 - 46.0) | 11.96 ± 9.55 (-9.0 - 46.0) |
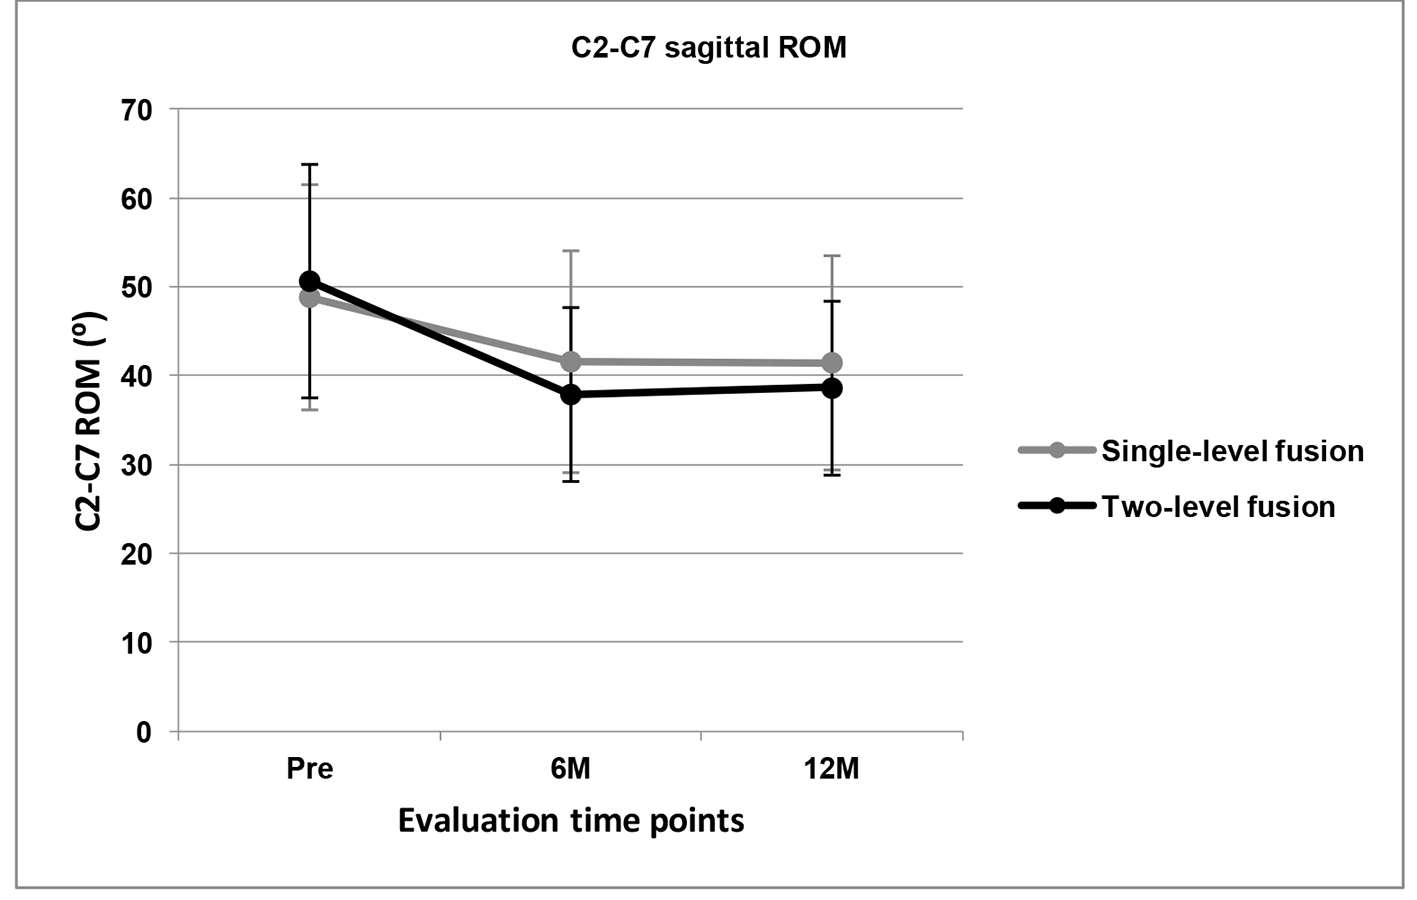
| ROM (n = 74) | 50.8 ± 12.59 (15.0 - 68.0) | 41.25 ± 12.24 (12.0 - 63.5) | 41.22 ± 11.82 (12.0 - 60.0) | |
| Subgroups | Cobb angle | ROM | |||||
|---|---|---|---|---|---|---|---|
| Preoperative | Postoperative | 6 M | 12 M | Preoperative | 6 M | 12 M | |
| M indicates months. Cobb angle and ROM (°). | |||||||
| Smokers (n = 37) | 14.95 ± 11.26 | 16.40 ± 8.74 | 11.40 ± 10.33 | 11.39 ± 10.29 | 51.45 ± 11.04 | 42.54 ± 10.91 | 42.80 ± 10.42 |
| Non-smokers (n = 37) | 13.93 ± 6.50 | 12.70 ± 6.71 | 12.01 ± 8.24 | 11.93 ± 8.22 | 48.50 ± 14.06 | 40.00 ± 13.45 | 39.68 ± 13.01 |
| P value | 0.637 | 0.085 | 0.780 | 0.804 | 0.320 | 0.386 | 0.269 |
| Myelopathy (n = 38) | 16.80 ± 7.89 | 15.55 ± 8.72 | 12.62 ± 8.61 | 12.58 ± 8.60 | 52.37 ± 10.93 | 42.26 ± 12.20 | 42.19 ± 11.32 |
| Radiculopathy (n = 36) | 11.71 ± 9.85 | 13.33 ± 7.06 | 10.60 ± 10.09 | 10.54 ± 10.03 | 47.00 ± 13.87 | 39.74 ± 12.13 | 39.74 ± 12.13 |
| P value | 0.079 | 0.238 | 0.360 | 0.354 | 0.069 | 0.390 | 0.387 |
| Single-level fusion (n = 66) | 13.86 ± 9.10 | 14.39 ± 7.36 | 11.26 ± 8.70 | 11.21 ± 8.65 | 49.88 ± 12.68 | 41.62 ± 12.49 | 41.50 ± 12.06 |
| Two-level fusion (n = 8) | 19.19 ± 8.62 | 15.87 ± 12.45 | 15.44 ± 13.35 | 15.37 ± 13.41 | 50.69 ± 13.14 | 37.93 ± 9.79 | 38.64 ± 9.79 |
| P value | 0.121 | 0.622 | 0.232 | 0.232 | 0.867 | 0.453 | 0.548 |