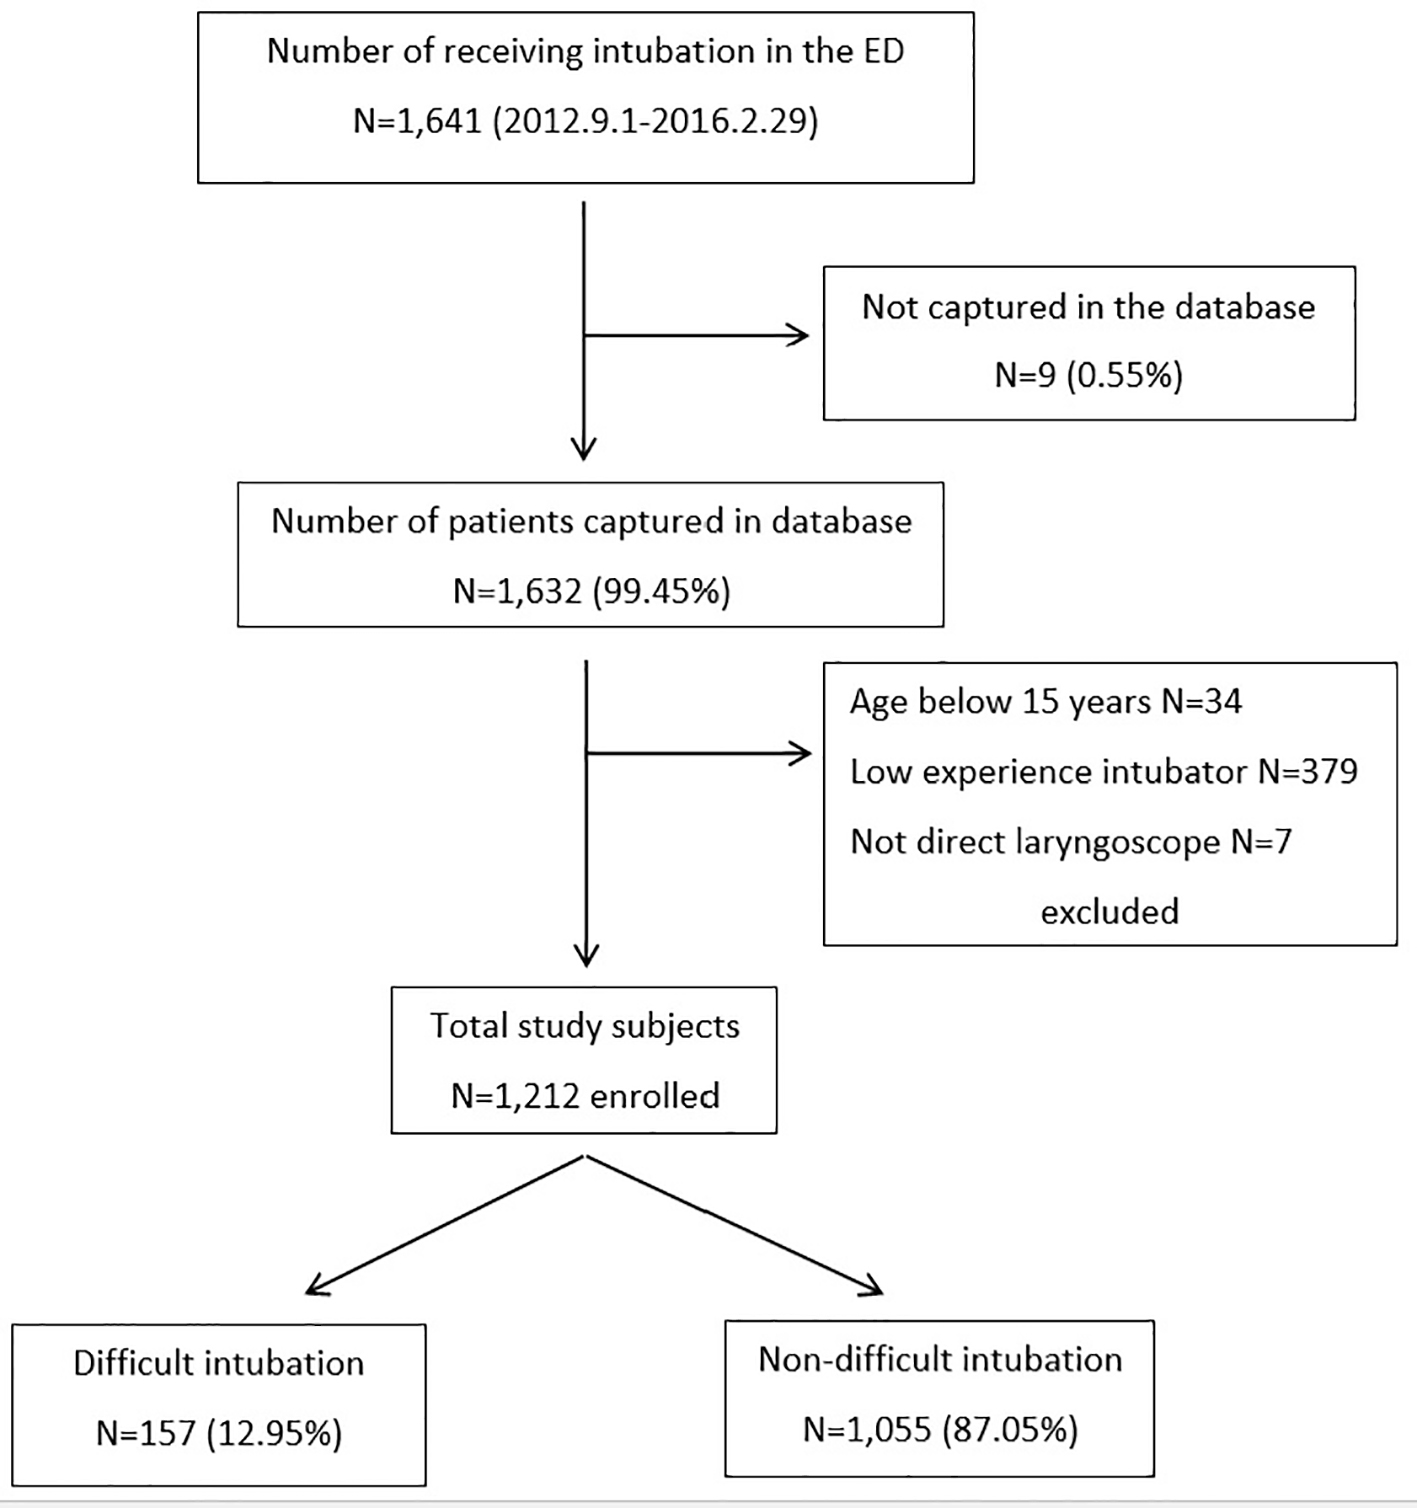
Figure 1. Flow diagram of the study patients enrolled. ED: emergency department.
| Journal of Clinical Medicine Research, ISSN 1918-3003 print, 1918-3011 online, Open Access |
| Article copyright, the authors; Journal compilation copyright, J Clin Med Res and Elmer Press Inc |
| Journal website http://www.jocmr.org |
Original Article
Volume 10, Number 3, March 2018, pages 247-253
Predicting Difficult Intubation in Emergency Department by Intubation Assessment Score
Figures
Tables
| Characteristics | Difficult intubation (n = 157), n (%) | Non-difficult intubation (n = 1,055), n (%) | P-value | AuROC (95% confidence interval) |
|---|---|---|---|---|
| AuROC: area under receiver operating characteristic curve. | ||||
| Male gender | 117 (74.5) | 661 (62.7) | 0.004 | 0.56 (0.52 - 0.60) |
| Age (year), mean (±SD) | 56.5 (± 18.7) | 60.4 (± 19.8) | 0.020 | 0.43 (0.39 - 0.48) |
| Glasgow coma scales | ||||
| 3 - 8 | 86 (62.8) | 575 (61.9) | 0.421 | 0.49 (0.45 - 0.53) |
| 9 - 13 | 23 (16.8) | 126 (13.6) | ||
| 14 - 15 | 28 (20.4) | 228 (24.5) | ||
| Traumatic causes | 41 (26.1) | 150 (14.2) | < 0.001 | 0.56 (0.52 - 0.60) |
| Method of intubation | ||||
| Rapid sequence | 27 (17.2) | 235 (22.3) | 0.053 | 0.50 (0.45 - 0.54) |
| Sedation only, without paralysis | 63 (40.1) | 323 (30.6) | ||
| No-medication assisted | 67 (42.7) | 497 (47.1) | ||
| Used of induction agents | 87 (55.4) | 555 (52.6) | 0.549 | 0.51 (0.47 - 0.56) |
| Mean number of attempts (± SD) | 2.0 (± 1.2) | 1.3 (± 0.7) | < 0.001 | n/a |
| Failed intubation | 18 (11.5) | 15 (1.42) | < 0.001 | n/a |
| Difficult intubation indicator | ||||
| Facial trauma | 15 (9.6) | 27 (2.6) | < 0.001 | 0.54 (0.51 - 0.56) |
| Large incisors | 12 (7.6) | 28 (2.7) | 0.003 | 0.52 (0.50 - 0.55) |
| Beard or mustache | 8 (5.1) | 33 (3.1) | 0.232 | 0.51 (0.49 - 0.53) |
| Large tongue | 50 (31.9) | 64 (6.1) | < 0.001 | 0.63 (0.59 - 0.67) |
| Limited mouth opening | 57 (36.3) | 71 (6.7) | < 0.001 | 0.65 (0.61 - 0.69) |
| Short hypo-mental distance | 24 (15.3) | 70 (6.6) | 0.001 | 0.54 (0.51 - 0.57) |
| Short thyro-hyoid distance | 22 (14.0) | 61 (5.8) | 0.001 | 0.54 (0.51 - 0.57) |
| Poor neck mobility | 63 (40.1) | 156 (14.8) | < 0.001 | 0.63 (0.59 - 0.67) |
| Presence of obstructed airway | 27 (17.2) | 15 (1.4) | < 0.001 | 0.58 (0.55 - 0.61) |
| Predictor | Odds ratio | 95% confidence interval | P-value | Beta coefficient | Score |
|---|---|---|---|---|---|
| Male gender | 1.82 | 1.17 - 2.83 | 0.008 | 0.59 | 1 |
| Large tongue | 4.47 | 2.72 - 7.35 | < 0.001 | 1.49 | 2 |
| Limited mouth opening | 3.93 | 2.44 - 6.31 | < 0.001 | 1.37 | 2 |
| Poor neck mobility | 2.76 | 1.81 - 4.19 | < 0.001 | 1.01 | 2 |
| Presence of obstructed airway | 7.54 | 3.57 - 15.93 | < 0.001 | 2.02 | 3 |
| Score | Total (n = 1,212) | Prevalence (%) | Difficult intubation (n = 157) | Non-difficult intubation (n = 1,055) | ||
|---|---|---|---|---|---|---|
| n | % | n | % | |||
| 0 | 331 | 27.3 | 10 | 3.0 | 321 | 97.0 |
| 1 | 516 | 42.6 | 30 | 5.8 | 486 | 94.2 |
| 2 | 65 | 5.3 | 12 | 18.5 | 53 | 81.5 |
| 3 | 188 | 15.5 | 45 | 23.9 | 143 | 76.1 |
| 4 | 28 | 2.3 | 13 | 46.4 | 15 | 53.6 |
| 5 | 47 | 3.9 | 22 | 46.8 | 25 | 53.2 |
| 6 | 11 | 0.9 | 6 | 54.6 | 5 | 45.4 |
| 7 | 14 | 1.1 | 9 | 64.3 | 5 | 35.7 |
| 8 | 6 | 0.5 | 5 | 83.3 | 1 | 16.7 |
| 9 | 3 | 0.3 | 2 | 66.7 | 1 | 33.3 |
| 10 | 3 | 0.3 | 3 | 100 | 0 | 0 |
| Score categorized probability groups | Score | Difficult intubation (n = 157), n (%) | Non-difficult intubation (n = 1,055), n (%) | Likelihood ratio of positive | 95% confidence interval | P-value |
|---|---|---|---|---|---|---|
| Low | ≤ 1 | 40 (4.7) | 807 (95.3) | 0.33 | 0.25 - 0.44 | < 0.001 |
| Intermediate | 2 - 3 | 57 (22.5) | 196 (77.5) | 1.95 | 1.53 - 2.49 | < 0.001 |
| High | ≥ 4 | 60 (53.6) | 52 (46.4) | 7.75 | 5.56 - 10.79 | < 0.001 |
| Mean (± SD) | - | 3.43 (± 2.3) | 1.2 (± 1.3) | < 0.001 |