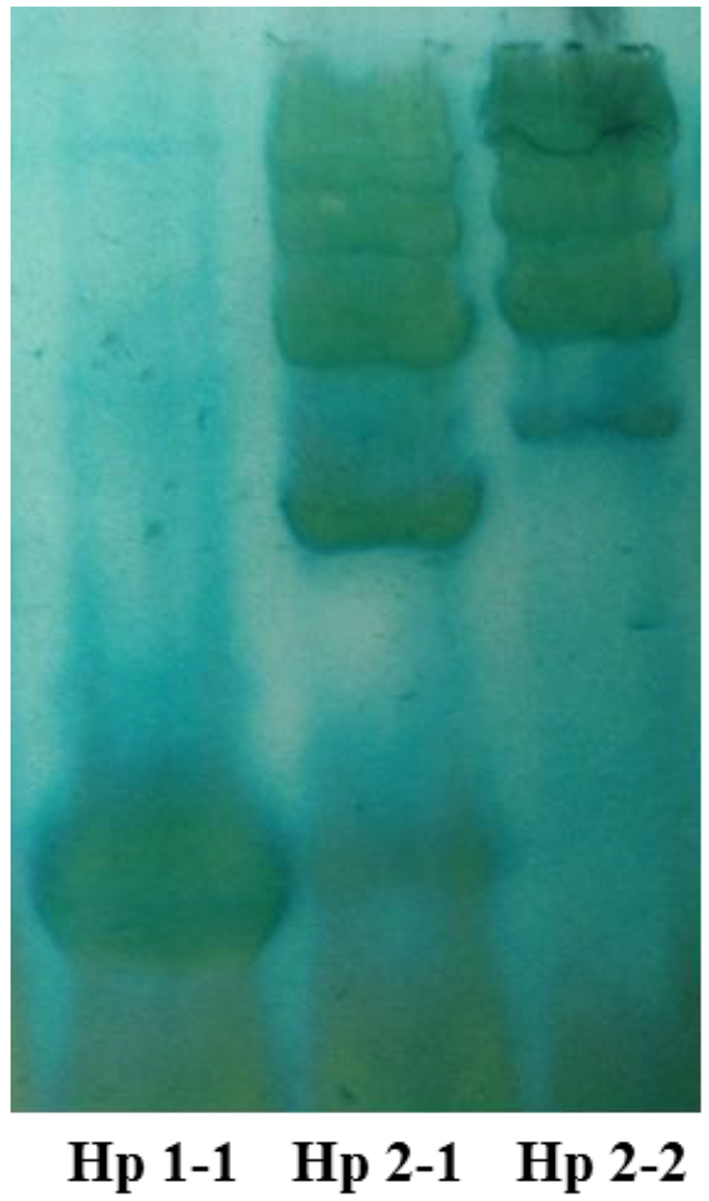
Figure 1. Representative profile of the three Hp phenotypes in plasma samples using native-PAGE. The pattern reveals heterogeneity in Hp 2-1 and Hp 2-2, but not in Hp 1-1.
| Journal of Clinical Medicine Research, ISSN 1918-3003 print, 1918-3011 online, Open Access |
| Article copyright, the authors; Journal compilation copyright, J Clin Med Res and Elmer Press Inc |
| Journal website http://www.jocmr.org |
Original Article
Volume 10, Number 3, March 2018, pages 196-201
Haptoglobin Phenotype Among Arab Patients With Mental Disorders
Figures
Table
| Patient group | Age | Gender, M, F/total (%) | Hp 1-1 (%) | Hp 2-2 (%) | Hp 2-1 (%) |
|---|---|---|---|---|---|
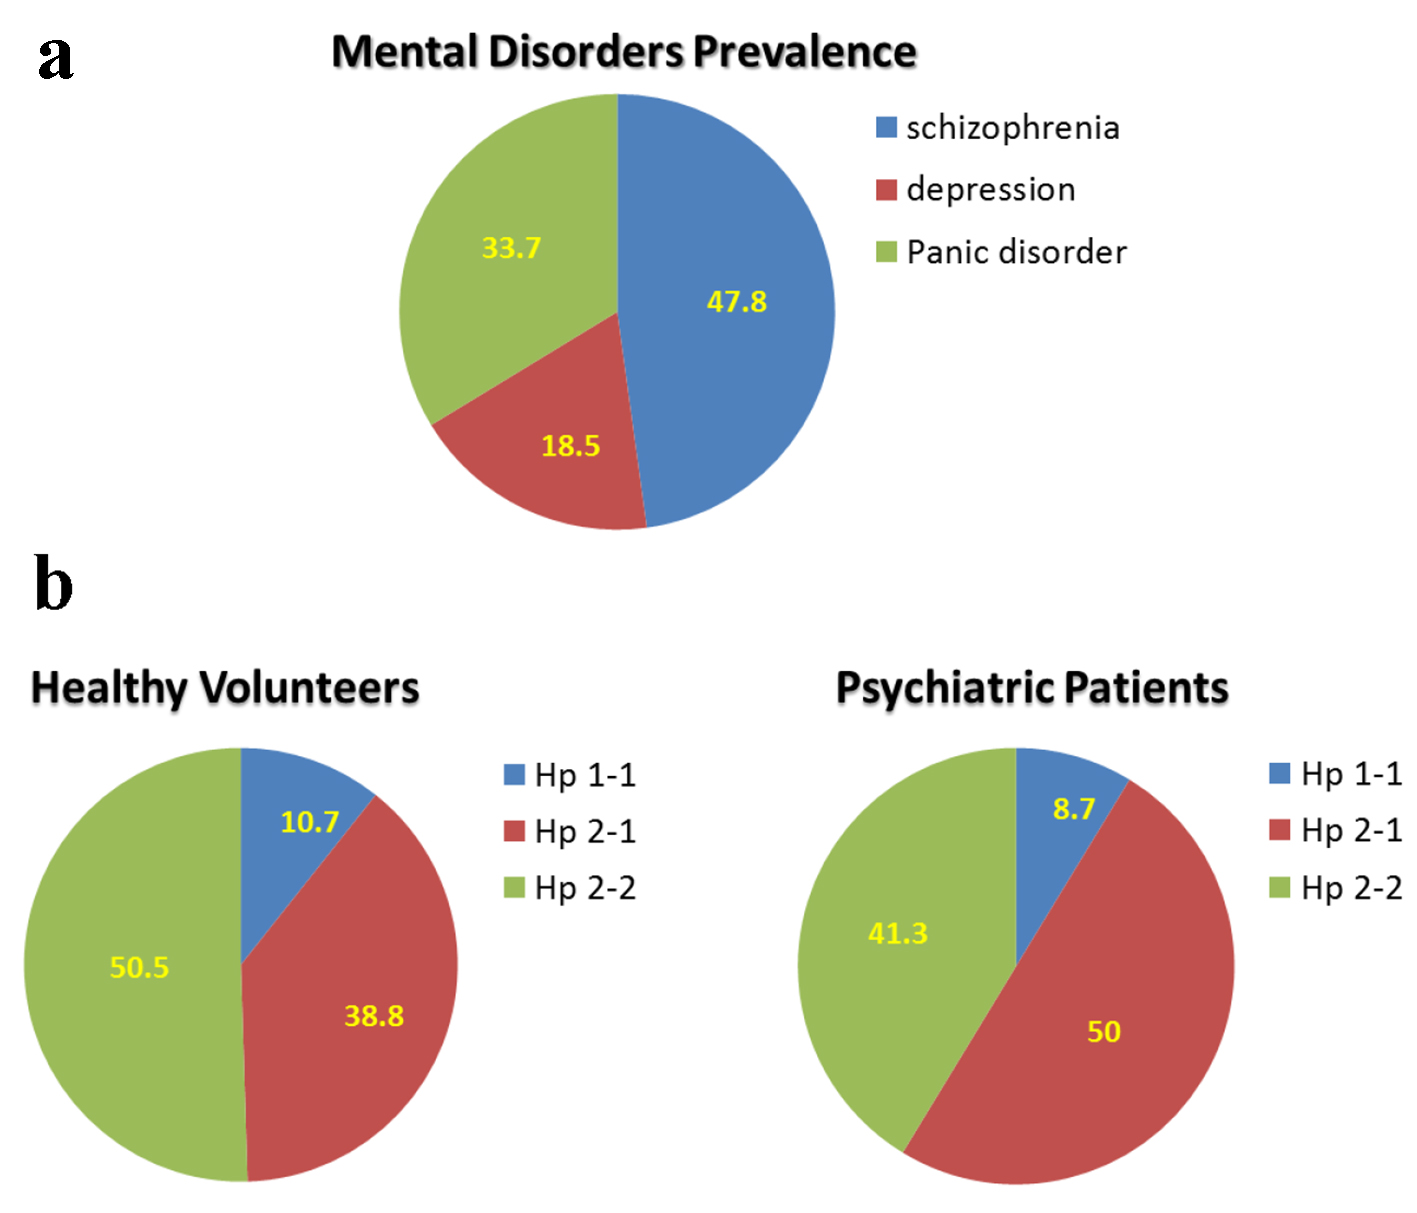
| Healthy subjects (n = 206) | 42.6 ± 0.9 | M: 83/206 (40%) F: 123/206 (60%) | 10.7 | 38.8 | 50.5 |
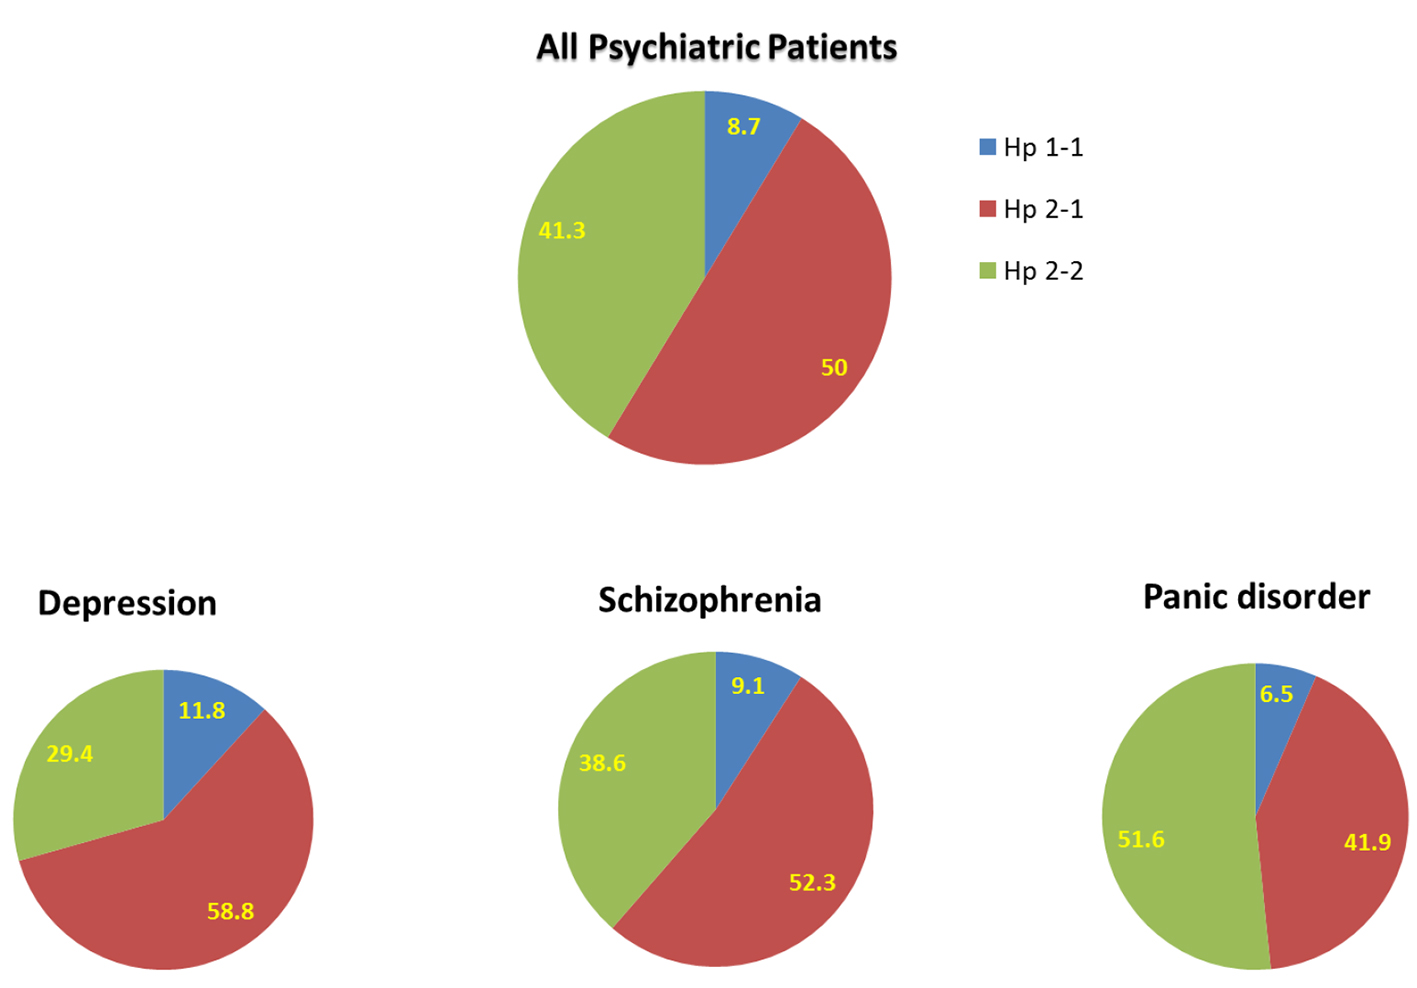
| Schizophrenia (n = 44) | 39.0 ± 1.5 | M: 25/44 (57%) F: 19/44 (43%) | 9.1 | 52.3 | 38.6 |
| Depression (n = 17) | 44.5 ± 3.1 | M: 5/17 (29%) F: 12/17 (71%) | 11.8 | 58.8 | 29.4 |
| Panic (n = 31) | 44.9 ± 2.7 | M: 8/31 (26%) F: 23/31 (74%) | 6.5 | 41.9 | 51.6 |