Journal of Clinical Medicine Research, ISSN 1918-3003 print, 1918-3011 online, Open Access
Article copyright, the authors; Journal compilation copyright, J Clin Med Res and Elmer Press Inc
Journal website http://www.jocmr.org

Original Article

Volume 10, Number 1, January 2018, pages 41-49


Improvement of Diurnal Blood Pressure Variation by Azilsartan

Figures

Figure 1.
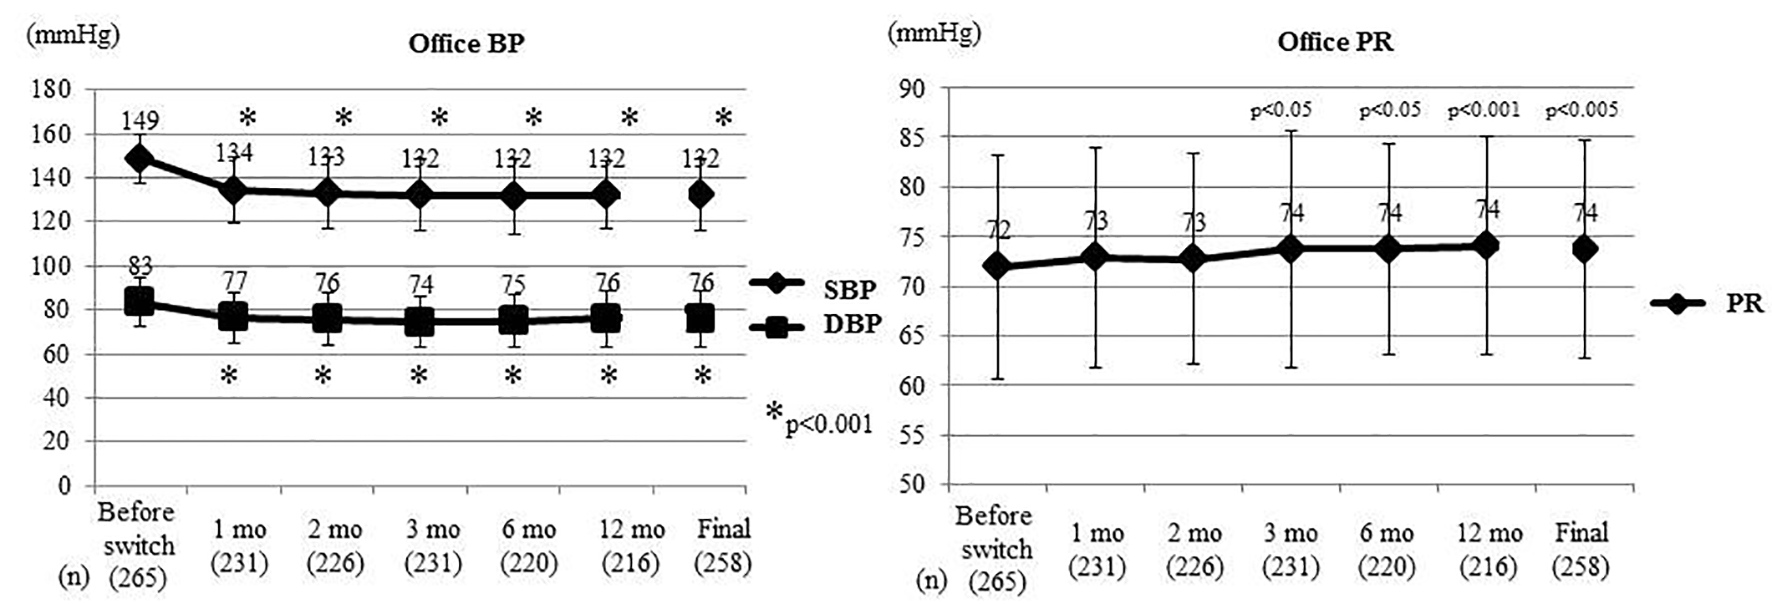
Figure 1. Changes of office BP and PR. At the Final, the last values are shown including patients who experienced deviation. Office BP and PR were compared between before switching and each time point after switching by the t-test. Office SBP and DBP decreased significantly from 1 month after switching, while office PR increased significantly from 3 months. BP: blood pressure; PR: pulse rate; SBP: systolic BP; DBP: diastolic BP; mo: month(s).
Figure 2.
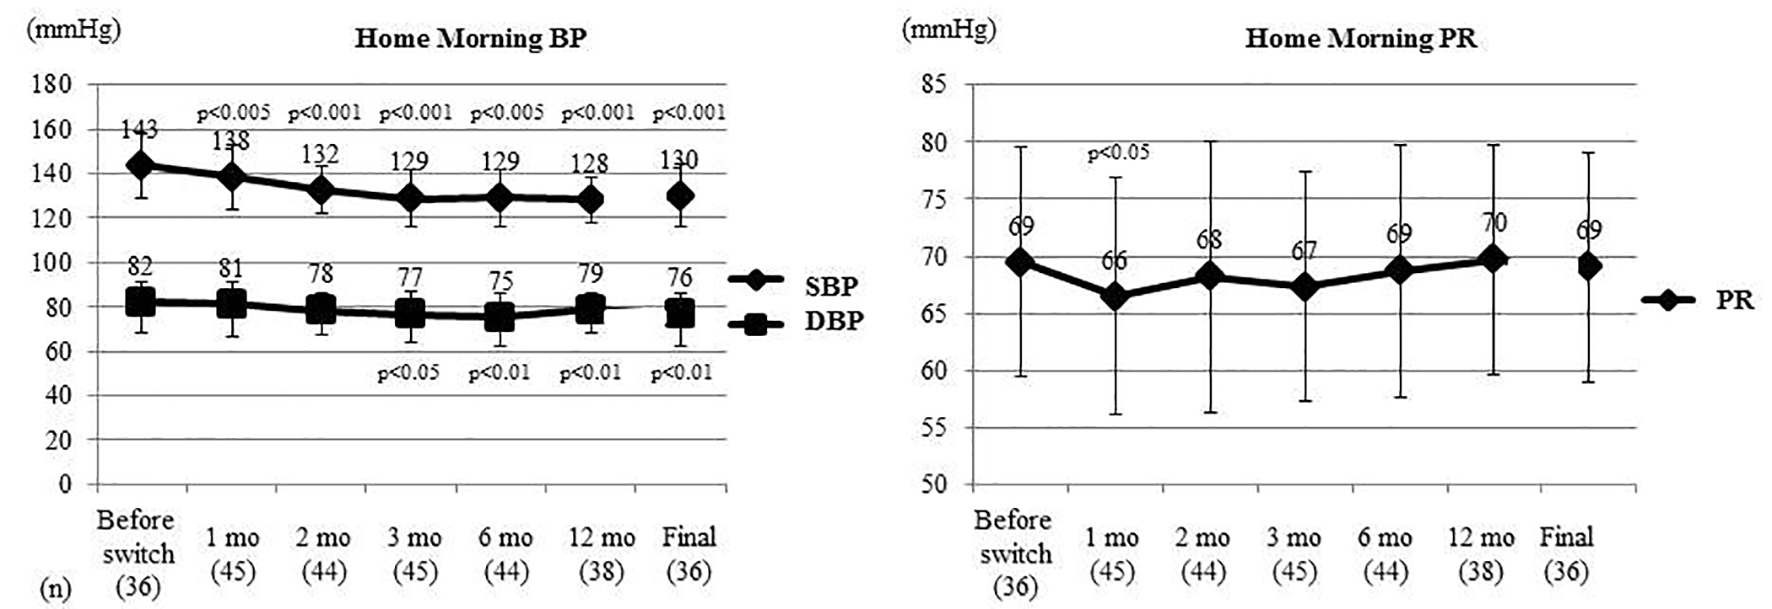
Figure 2. Changes of home morning BP and PR. Home morning BP and PR were compared between before switching and each time point after switching by the t-test. Home morning SBP was significantly decreased from 1 month after switching and home morning DBP was significantly decreased from 3 months. Home morning PR only showed a significant decrease at 1 month. BP: blood pressure; PR: pulse rate; SBP: systolic BP; DBP: diastolic BP; mo: month(s).
Figure 3.
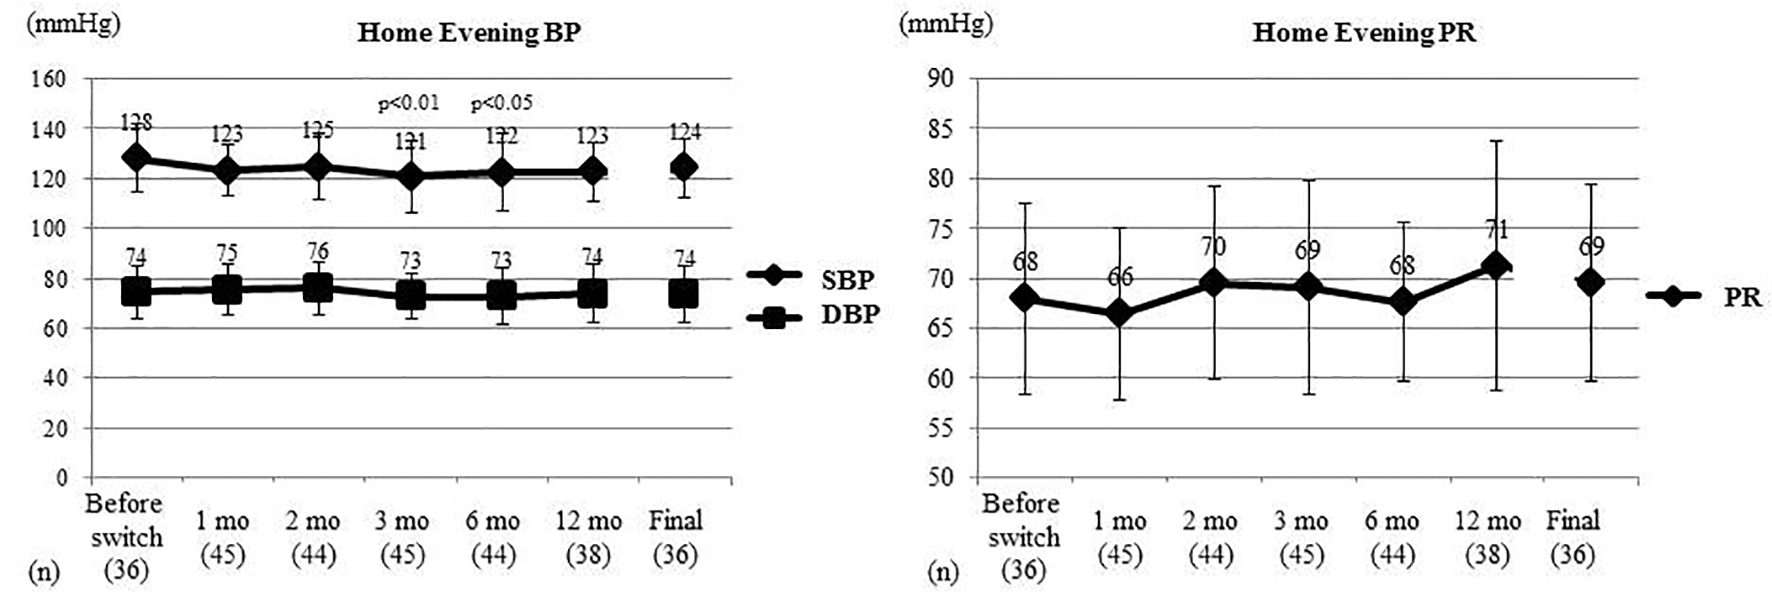
Figure 3. Changes of home evening BP and PR. Home evening BP and PR were compared between before switching and each time point after switching by the t-test. Home evening SBP showed a significant decrease at 3 and 6 months after switching, while home evening DBP and home evening PR did not change significantly. BP: blood pressure; PR: pulse rate; SBP: systolic BP; DBP: diastolic BP; mo: month(s).

Tables

Table 1. Characteristics of the Patients (n = 265)
 
IQR: interquartile range; BMI: body mass index; DM: diabetes mellitus; DL: dyslipidemia; CKD: chronic kidney disease; CVD: cardiovascular disease.
Age, median (IQR), years72 (62 - 81)
Male gender, n (%)142 (54)
Current smoking, n (%)52 (20)
Drinking alcohol, n (%)128 (48)
BMI, median (IQR), years24.1 (21.6 - 26.5)
DM, n (%)66 (25)
DL, n (%)130 (49)
CKD, n (%)1 (0.4)
Stroke, n (%)26 (10)
CVD, n (%)38 (14)


Table 2. ARB Therapy Before Switching to Azilsartan
 
ARBnDose (mg)n
The number of patients using each ARB before switching is shown with the dosages. ARB: angiotensin II receptor blocker.
Losartan35251
5032
1002
Candesartan8743
877
61
126
Valsartan58202
403
8045
1607
Unknown1
Olmesartan42103
2027
302
4010
Telmisartan234022
801
Irbesartan18501
10015
2002
Unknown22
Total265265


Table 3. Changes of the Dose of Azilsartan
 
Azilsartan dose (mg)Dose just after switching (n)Final dose (n)Dose reduction (n)Dose escalation (n)
The number of patients receiving each dose at initiation of azilsartan, the number of patients receiving each dose at final assessment (including drop-outs), and the number of patients with dose escalation or reduction are shown. A total of 214 patients were switched to 20 mg of azilsartan, followed by switching to 40 mg in 48 patients. At final assessment, 191 patients were receiving 20 mg and 67 patients were receiving 40 mg (including 21 patients with dose escalation from 20 mg).
5011 (from 20 mg)0
10254 (from 20 mg)0
202141912 (from 40 mg)1 (from 10 mg)
404867021 (from 20 mg)
Unknown1100
Total265265722


Table 4. Changes of Office BP and PR After Switching From the Standard Dose or Higher Dose of Other ARBs
 
Before switch (mm Hg) (SD)Final (mm Hg) (SD)P value
SBPDBPPRSBPDBPPRSBPDBPPR
After switching from the standard dose of other ARBs to azilsartan (20 mg), a significant decrease of office SBP was always observed. Except with irbesartan, there was also a significant decrease of office DBP after switching from the standard dose of other ARBs to azilsartan (20 mg). Office PR increased significantly after switching from valsartan (80 mg) to azilsartan (20 mg). Comparison of office SBP between before switching and final assessment was performed by using the t-test. AZ: azilsartan; SD: standard deviation; CA: candesartan; IR: irbesartan; LO: losartan; OL: olmesartan; TE: telmisartan; VA: valsartan; NS: not significant; SBP: systolic blood pressure; DBP: diastolic blood pressure; PR: pulse rate.
All patients (258)149 (10)83 (11)72 (11)132 (16)76 (12)74 (11)< 0.001< 0.001< 0.005
CA 8 mg → AZ 20 mg (62)148 (11)85 (9)71 (11)129 (14)78 (11)73 (12)< 0.001< 0.0010.071
CA 12 mg → AZ 40 mg (5)150 (11)75 (11)73 (7)150 (16)77 (4)78 (6)NSNSNS
IR 100 mg → AZ 20 mg (10)147 (8)83 (14)65 (11)131 (10)77 (10)70 (16)< 0.005NSNS
IR 200 mg → AZ 40 mg (2)130 (28)85 (7)66 (8)122 (3)70 (3)61 (16)NSNSNS
LO 50 mg → AZ 20 mg (29)150 (9)84 (9)73 (11)132 (16)74 (13)73 (9)< 0.001< 0.001NS
LO 100 mg → AZ 40 mg (2)154 (6)93 (14)73 (8)146 (5)85 (10)68 (1)NSNSNS
OL 20 mg → AZ 20 mg (20)155 (12)81 (11)73 (12)140 (18)77 (12)75 (12)< 0.001<0.05NS
OL 40 mg → AZ 40 mg (7)149 (14)84 (15)71 (15)131 (15)76 (8)77 (18)0.052NSNS
TE 40 mg → AZ 20 mg (14)149 (8)85 (14)74 (11)138 (14)73 (17)78 (12)< 0.01< 0.005NS
TE 80 mg → AZ 40 mg (1)159 (-)81 (-)(-)135 (-)70 (-)(-)
VA 80 mg → AZ 20 mg (36)148 (9)81 (9)71 (10)130 (18)73 (13)74 (11)< 0.001< 0.005< 0.05
VA 160 mg → AZ 40 mg (5)152 (17)83 (17)67 (19)128 (15)72 (11)69 (13)< 0.05< 0.05NS


Table 5. Morning-Evening Difference of Home SBP, DBP, and PR
 
Before changeFinalP value
Comparison between before switching and final assessment was performed by using the t-test. SD: standard deviation; SBP: systolic blood pressure; DBP: diastolic blood pressure; PR: pulse rate; NS: not significant.
Morning-evening SBP difference, mean (SD), n = 2014.6 (16.2)6.6 (14.6)0.09
Morning-evening DBP difference, mean (SD), n = 207.5 (9.2)4.4 (10.5)NS
Morning-evening PR difference, mean (SD), n = 171.7 (5.1)4.5 (6.1)< 0.05


Table 6. Changes of Various Parameters After Switching to Azilsartan
 
Before switching3 months afterP value6 months afterP value12 months afterP value
After switching to azilsartan, eGFR decreased significantly (3, 6, and 12 months) and uric acid increased significantly (12 months). On the ECG, SV1 + RV5 was significantly reduced at 12 months. The t-test was used to assess significance if the distribution was normal, while Wilcoxon’s signed rank test was used if the distribution was not normal. Hb: hemoglobin; γ-GTP: γ-glutamyl transferase; eGFR: estimated glomerular filtration rate; UA: uric acid; Na: sodium; K: potassium; HbA1c: hemoglobin A1c; UP: urine protein; SD: standard deviation; IQR: interquartile range; NS: not significant.
Hb, g/dL, mean (SD)13.4 (1.5)13.3 (1.6)0.0713.3 (1.5)NS13.4 (1.6)NS
γGTP, U/L, median (IQR)27 (19 - 48)29.5 (20 - 50)NS28 (19 - 47)NS26.5 (18 - 46)NS
eGFR, mL/min/1.73 m2, mean (SD)64.2 (16.5)62.8 (16.5)< 0.0559.8 (16.2)< 0.00160.4 (17.4)< 0.001
UA, mg/dL, mean (SD)5.5 (1.4)5.6 (1.3)NS5.7 (1.2)NS5.8 (1.5)< 0.05
Na, mmol/L, mean (SD)141 (2)141 (2)NS141 (3)NS141 (2)NS
K, mmol/L, mean (SD)4.3 (0.4)4.3 (0.5)NS4.4 (0.4)NS4.4 (0.5)NS
HbA1c, %, mean (SD)6.1 (1.0)6.2 (1.0)NS6.3 (1.0)NS6.1 (0.9)NS
UP qualitative, median (IQR)0 (0 - 0)0 (0 - 0)NS0 (0 - 0)NS0 (0 - 0)NS
SV1 + RV5 (cm), mean (SD)2.6 (0.8)2.4 (0.8)NS2.5 (0.8)0.092.5 (0.6)< 0.05


Table 7. Correlations Between the Final Change of Blood Pressure and Various Parameters Before Switching to Azilsartan
 
ParameterSpearman’s rank correlation coefficientP value
Correlations were tested by Spearman’s rank correlation coefficient analysis. The antihypertensive effect of azilsartan was stronger in patients with a lower BMI, higher SBP, higher Hb, lower HbA1c, and lower SV1 + RV5 at initiation of treatment. BMI: body mass index; SBP: systolic blood pressure; DBP: diastolic blood pressure; PR: pulse rate; Hb: hemoglobin; γ-GTP: γ-glutamyl transferase; eGFR: estimated glomerular filtration rate; TG: triglycerides; HDL-C: high-density lipoprotein cholesterol; LDL-C: low-density lipoprotein cholesterol; UA: uric acid; Na: sodium; K: potassium; HbA1c: hemoglobin A1c; UP: urine protein; NS: not significant.
Age0.29NS
BMI0.14< 0.05
SBP0.38< 0.001
DBP0.09NS
PR0.008NS
Hb0.149< 0.05
γ-GTP0.007NS
eGFR0.025NS
TG0.073NS
HDL-C0.055NS
LDL-C0.12NS
UA0.7NS
HbA1c0.21< 0.05
Na0.08NS
K0.072NS
UP0.150.06
SV1 + RV50.401< 0.005


Table 8. Changes of SBP in Patients With or Without Other Concomitant Antihypertensive Agents at Switching From Candesartan (8 mg) to Azilsartan (20 mg)
 
Antihypertensive agent (n)Change of SBP (mm Hg) (SD)P value
Comparisons were performed by the two-sample t-test or Welch’s test. There were no significant differences of the antihypertensive effect of azilsartan between patients with or without concomitant diuretics, calcium antagonists, or β-blockers. SBP: systolic blood pressure; SD: standard deviation.
Diuretic (-) (49)-17.7 (14.4)NS
Diuretic (+) (13)-20.2 (9.7)
Calcium antagonist (-) (29)-16.2 (13.6)NS
Calcium antagonist (+) (33)-20 (13.4)
β-blocker (-) (53)-18 (12.8)NS
β-blocker (+) (9)-19.6 (18.3)