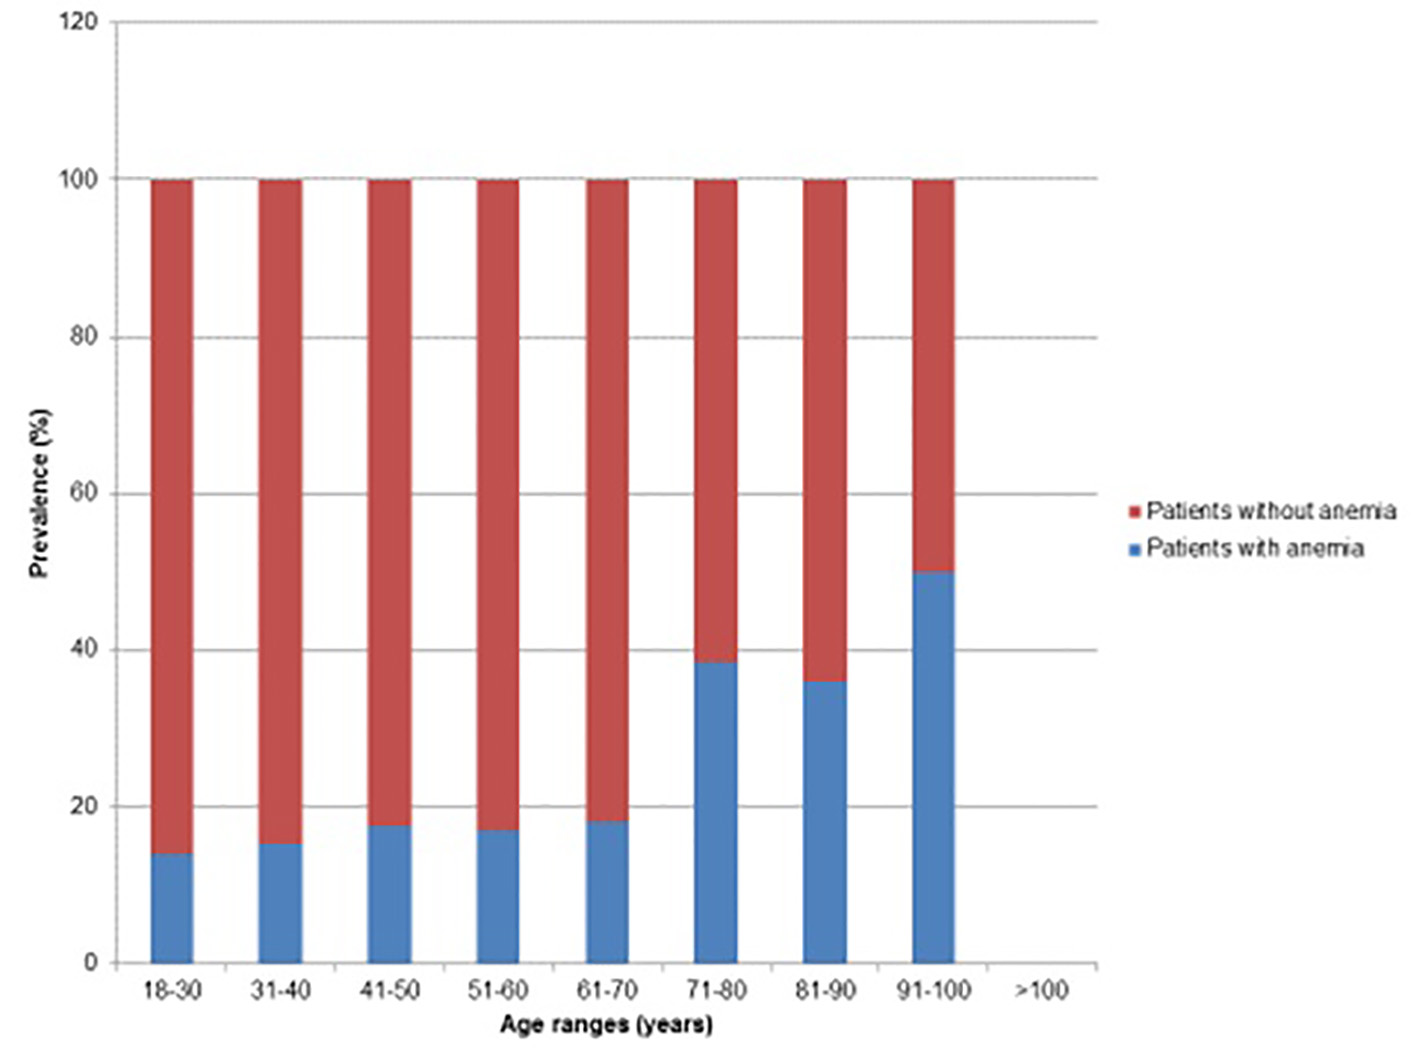
Figure 1. Prevalence of anemia with respect to age.
| Journal of Clinical Medicine Research, ISSN 1918-3003 print, 1918-3011 online, Open Access |
| Article copyright, the authors; Journal compilation copyright, J Clin Med Res and Elmer Press Inc |
| Journal website http://www.jocmr.org |
Original Article
Volume 9, Number 12, December 2017, pages 970-980
Prevalence, Comorbidity and Investigation of Anemia in the Primary Care Office
Figures
Tables
| Variable | Percentage of patients |
|---|---|
| Male | |
| Female | 59.5 |
| Race | |
| Caucasian | 73.3 |
| African-American | 10.6 |
| Hispanic | 8.6 |
| Asian | 2.4 |
| Other | 5.1 |
| Social history | |
| Current smoker | 11.6 |
| Former smoker | 28.1 |
| Never smoker | 60.3 |
| Active alcohol use | 61.7 |
| Family history of hereditary anemia | |
| Sickle cell anemia | 0.2 |
| Thalassemia | 0 |
| RBC membrane defect | 0 |
| Other | 0.6 |
| No family history of anemia | 99.1 |
| Personal history of anemia | |
| Sickle cell | 0.2 |
| Thalassemia | 0.4 |
| RBC membrane defect | 0 |
| No personal history of anemia | 90.7 |
| Other | 8.4 |
| Comorbidities | |
| Diabetes mellitus | 17.2 |
| Essential hypertension | 45.3 |
| Hypothyroidism | 12.8 |
| Chronic kidney disease | 4.6 |
| Malignancy | 10 |
| Rheumatologic disease | 3.8 |
| Chronic liver disease | 4 |
| Congestive heart failure | 2.8 |
| Coronary artery disease | 10.2 |
| Chronic obstructive pulmonary disease | 3 |
| Average age | 56.3 years |
| Average BMI | 29.4 kg/m2 |
| Patients without anemia (N = 389), % | Patients with anemia (N = 108), % | P value | |
|---|---|---|---|
| Male | 44.5 | 20.3 | < 0.0001 |
| Female | 55 | 79.6 | < 0.0001 |
| Race | |||
| Caucasian | 77.9 | 56.5 | < 0.0001 |
| African-American | 7.5 | 24 | < 0.0001 |
| Hispanic | 7.2 | 5.5 | < 0.0001 |
| Asian | 2.3 | 2.8 | < 0.0001 |
| Other | 5.1 | 3.7 | < 0.0001 |
| Social history | |||
| Current smoker | 12.1 | 10.2 | 0.5873 |
| Former smoker | 26.9 | 32.4 | 0.2689 |
| Never smoker | 60.9 | 57.4 | 0.5092 |
| Active alcohol use | 67.8 | 54.6 | 0.0846 |
| Family history of hereditary anemia | |||
| Sickle cell anemia | 0.3 | 0 | 0.5691 |
| Thalassemia | 0 | 0 | |
| RBC membrane defect | 0 | 0 | |
| Other | 0 | 0 | |
| No family history of anemia | 99.7 | 100 | 0.5691 |
| Personal history of anemia | |||
| Sickle cell | 0 | 0.93 | 0.0572 |
| Thalassemia | 0.3 | 0.93 | 0.3803 |
| RBC membrane defect | 0 | 0 | |
| No personal history of anemia | 97.4 | 67.6 | < 0.0001 |
| Other | 2.3 | 30.5 | < 0.0001 |
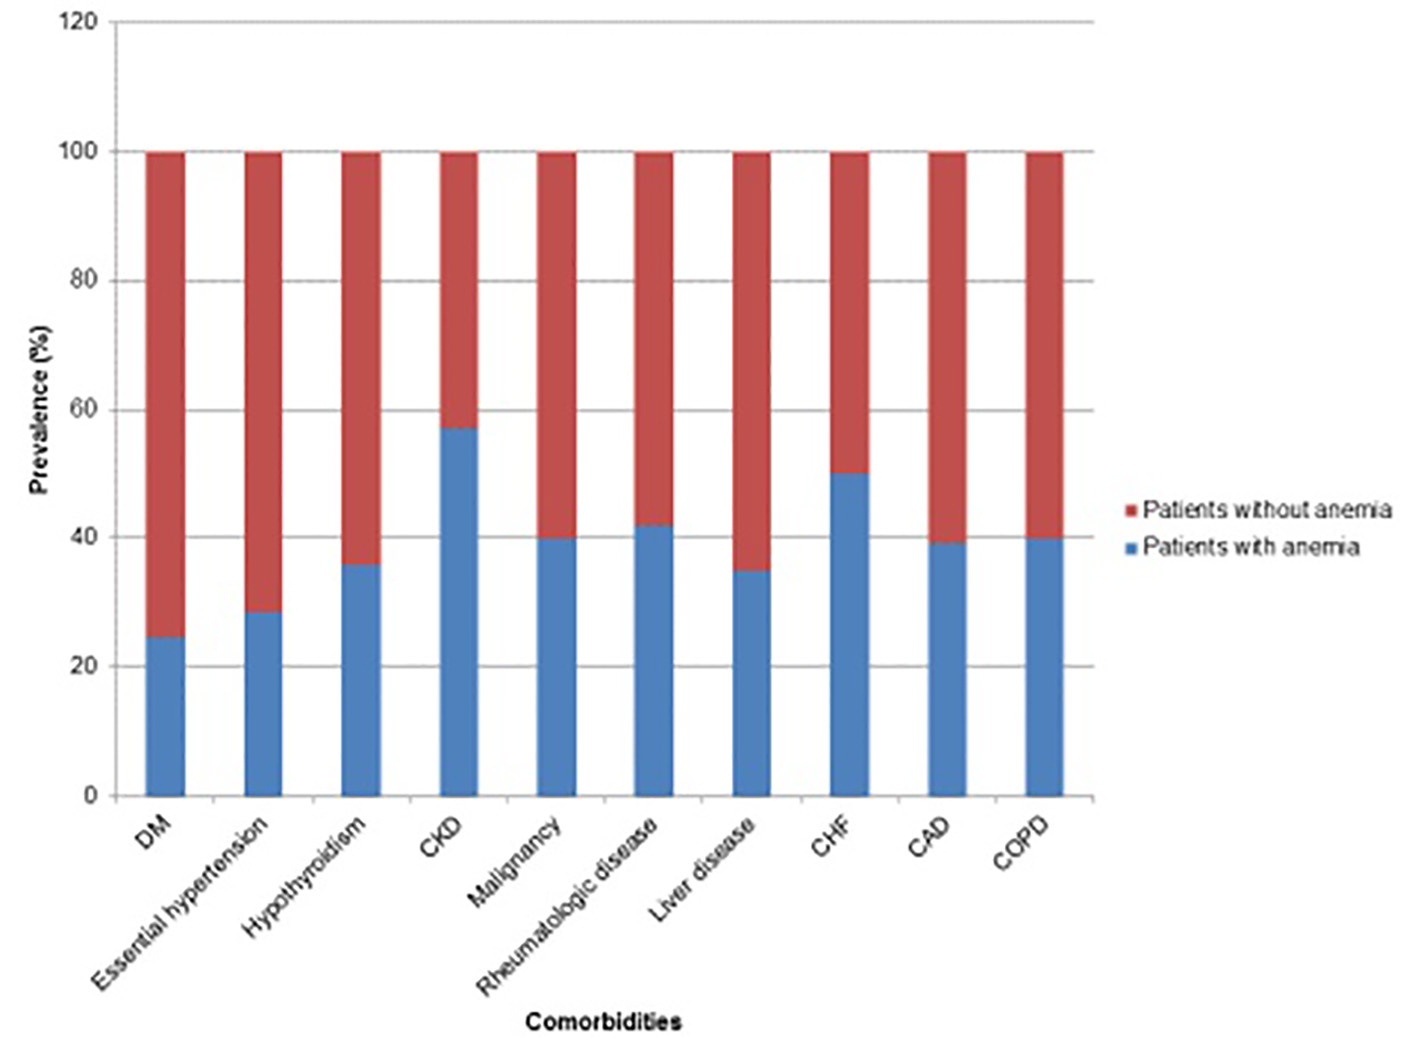
| Comorbidities | Patients without anemia (N = 389), % | Patients with anemia (N = 108), % | P value |
|---|---|---|---|
| Diabetes mellitus | 16.4 | 19.4 | 0.4651 |
| Essential hypertension | 41.1 | 59.3 | 0.0008 |
| Hypothyroidism | 10.5 | 21.3 | 0.003 |
| Chronic kidney disease | 2.3 | 11.1 | 0.0001 |
| Malignancy | 7.7 | 18.5 | 0.001 |
| Rheumatologic disease | 2.8 | 7.4 | 0.0269 |
| Chronic liver disease | 3.3 | 6.5 | 0.1355 |
| Congestive heart failure | 1.8 | 6.5 | 0.0091 |
| Coronary artery disease | 7.9 | 18.5 | 0.0014 |
| Chronic obstructive pulmonary disease | 2.3 | 5.6 | 0.08 |
| Average age | 54.5 years | 62.6 years | < 0.0001 |
| Average BMI | 29 kg/m2 | 30.5 kg/m2 | 0.054 |
| Average number of comorbid illnesses | 0.96 | 1.74 | < 0.0001 |
| Patients with mild anemia (N = 65), % | Patients with moderate anemia (N = 43), % | P value | |
|---|---|---|---|
| Male | 29.2 | 16.2 | 0.125 |
| Female | 70.7 | 83.7 | 0.125 |
| Race | |||
| Caucasian | 60.0 | 51.2 | < 0.0001 |
| African-American | 18.5 | 32.6 | < 0.0001 |
| Hispanic | 15.4 | 9.3 | < 0.001 |
| Asian | 3.1 | 2.3 | < 0.001 |
| Other | 3.1 | 4.7 | < 0.001 |
| Social history | |||
| Current smoker | 9.2 | 11.6 | 0.6882 |
| Former smoker | 35.4 | 27.9 | 0.4185 |
| Never smoker | 55.4 | 60.5 | 0.6029 |
| Active alcohol use | 60.0 | 44.2 | 0.1083 |
| Family history of hereditary anemia | |||
| Sickle cell anemia | 0 | 2.3 | 0.2215 |
| Thalassemia | 0 | 2.3 | 0.2215 |
| RBC membrane defect | 0 | 0 | |
| Other | 0 | 51.2 | < 0.0001 |
| No family history of anemia | 100 | 44.2 | < 0.0001 |
| Personal history of anemia | |||
| Sickle cell | 0 | 2.3 | 0.2215 |
| Thalassemia | 0 | 2.3 | 0.2215 |
| RBC membrane defect | 0 | 0 | |
| No personal history of anemia | 16.9 | 44.2 | < 0.0001 |
| Other | 83.1 | 51.2 | 0.0002 |
| Mean corpuscular volume (MCV), fL/cell | |||
| < 80 | 30.2 | 4.6 | 0.0003 |
| 80 - 94 | 58.1 | 73.8 | 0.0893 |
| > 94 | 11.6 | 21.5 | 0.1875 |
| Comorbidities | Patients with mild anemia (N = 65), % | Patients with moderate anemia (N = 43), % | P value |
|---|---|---|---|
| Diabetes mellitus | 20 | 18.6 | 0.8578 |
| Essential hypertension | 61.5 | 55.8 | 0.557 |
| Hypothyroidism | 20 | 23.3 | 0.6877 |
| Chronic kidney disease | 9.2 | 11.6 | 0.6851 |
| Malignancy | 20 | 16.2 | 0.6201 |
| Rheumatologic disease | 6.15 | 9.3 | 0.5424 |
| Chronic liver disease | 6.15 | 6.9 | 0.866 |
| Congestive heart failure | 6.15 | 4.7 | 0.7401 |
| Coronary artery disease | 16.9 | 18.6 | 0.8211 |
| Chronic obstructive pulmonary disease | 4.6 | 6.9 | 0.6 |
| Average age | 64.8 years | 59 years | 0.1127 |
| Average BMI | 29.7 kg/m2 | 31.9 kg/m2 | 0.186 |
| Average number of comorbid illnesses | 1.76 | 1.72 | 0.8799 |
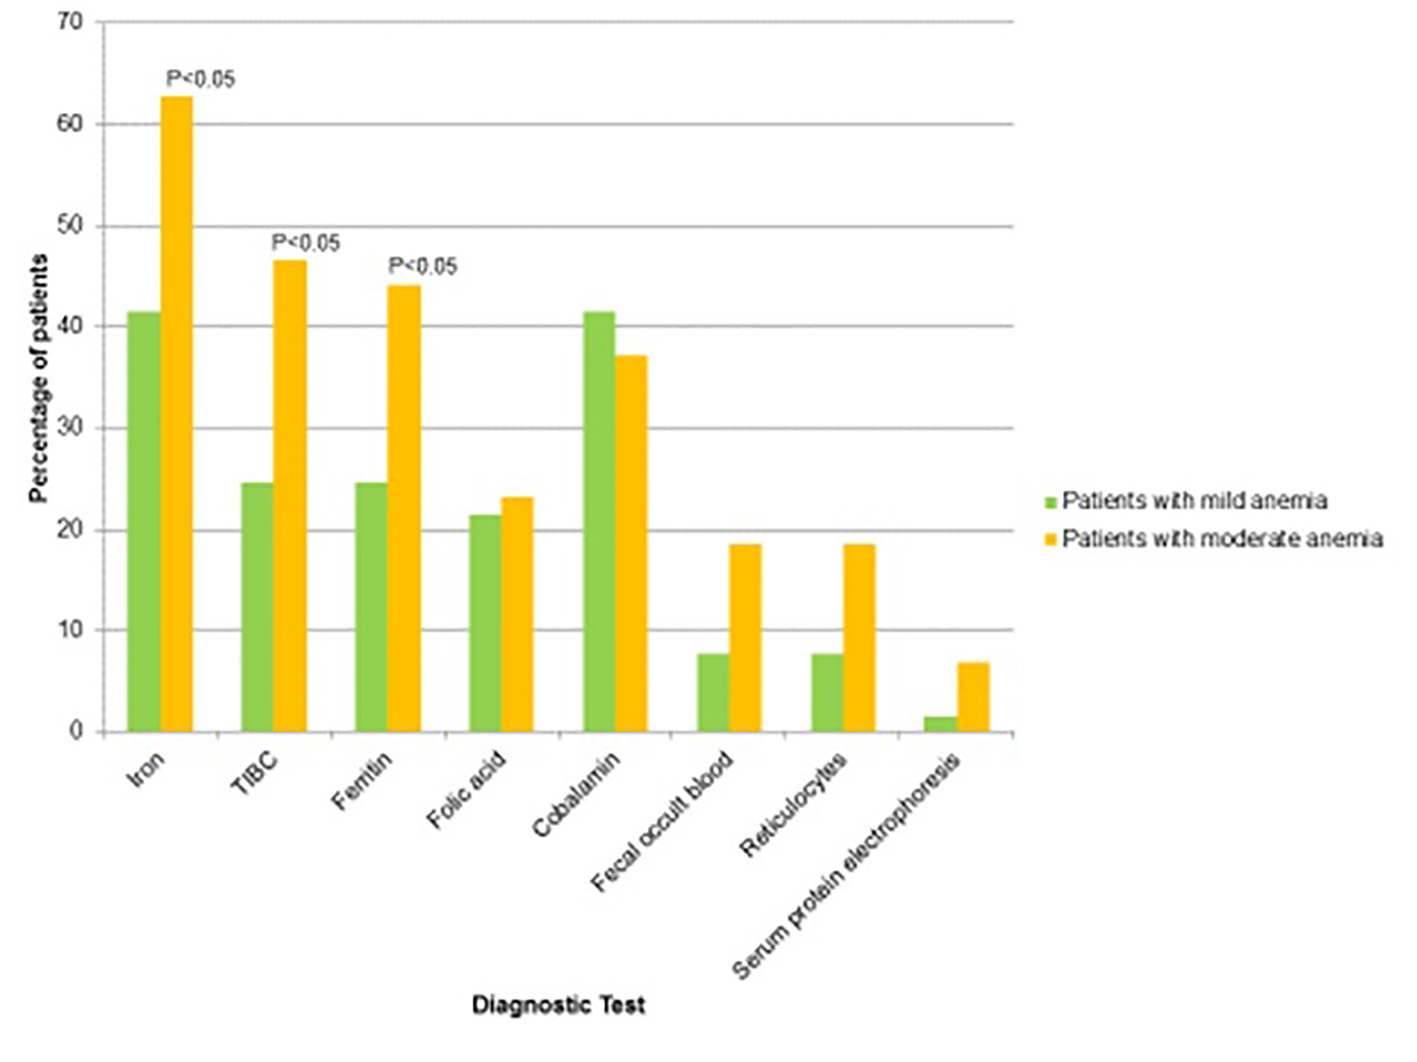
| Patients with mild anemia (N = 65), % | Patients with moderate anemia (N = 43), % | P value | |
|---|---|---|---|
| Iron | 41.5 | 62.8 | 0.0314 |
| Total iron binding capacity (TIBC) | 24.6 | 46.5 | 0.0187 |
| Ferritin | 24.6 | 44.1 | 0.0342 |
| Folic acid | 21.5 | 23.2 | 0.8343 |
| Cobalamin | 41.5 | 37.2 | 0.6543 |
| Fecal occult blood | 7.7 | 18.6 | 0.0895 |
| Reticulocytes | 7.7 | 18.6 | 0.0895 |
| Serum protein electrophoresis | 1.5 | 6.9 | 0.1448 |