Journal of Clinical Medicine Research, ISSN 1918-3003 print, 1918-3011 online, Open Access
Article copyright, the authors; Journal compilation copyright, J Clin Med Res and Elmer Press Inc
Journal website http://www.jocmr.org

Original Article

Volume 9, Number 12, December 2017, pages 1007-1012


Urate-Lowering Therapy Ameliorates Kidney Function in Type 2 Diabetes Patients With Hyperuricemia

Figures

Figure 1.
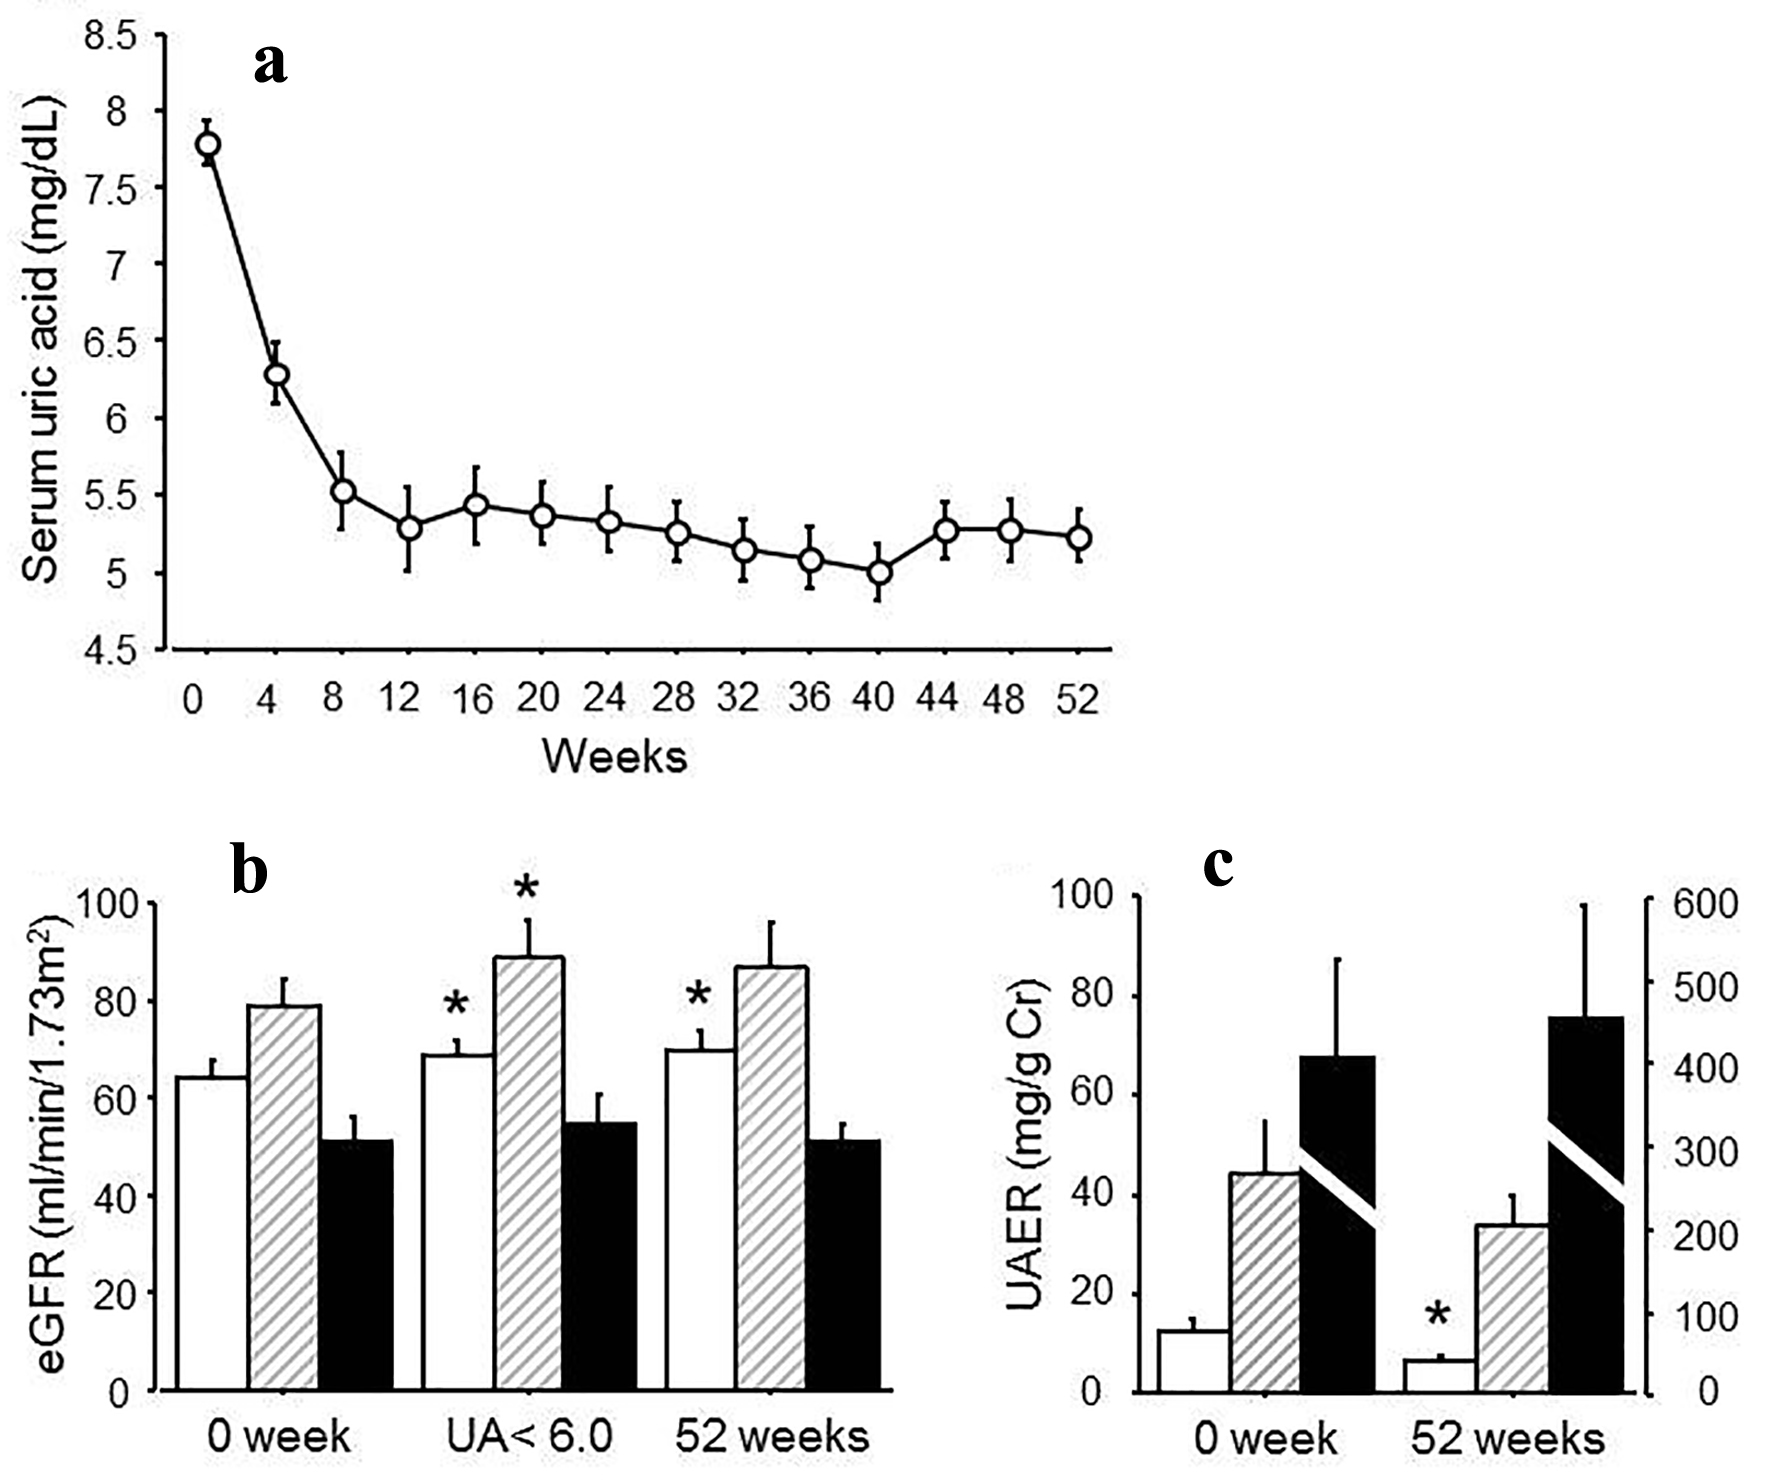
Figure 1. (a) Changes in serum urate levels after the treatment for 52 weeks. (b) eGFR at 0 week, at the point when uric acid reached under 6.0 mg/dL and at 52 weeks after the treatment. White bars: no albuminuria; shaded bars: microalbuminuria; black bars: macroalbuminuria. (c) UAER at 0 and 52 weeks after the treatment. White bars: no albuminuria; stripe bars: microalbuminuria; black bars: macroalbuminuria. *P < 0.05 vs. 0 week.
Figure 2.
Figure 2. (a) Relationship between ΔUACR and UACR at 0 week (r = -0.76, P < 0.0001). (b) Relationship between ΔeGFR and ΔUA (r = -0.4, P = 0.03).

Tables

Table 1. Baseline Characteristics of the Subjects
 
BMI: body mass index; HbA1c: glycosylated hemoglobin A1c; eGFR: estimated glomerular filtration rate; UACR: urine albumin-to-creatinine ratio; SBP: systolic blood pressure; DBP: diastolic blood pressure; GLP1 RA: glucagon-like peptide-1 receptor agonist; DPP-4: dipeptidyl peptidase 4 inhibitor; SGLT2: sodium-glucose co-transporter 2; αGI: alfa-glucosidase.
Age58 ± 2
Male/female9/5
BMI (kg/m2)26.7 ± 0.9
Serum urate (mg/dL)7.8 ± 0.1
eGFR (mL/min/1.73 m2)66.0 ± 3.1
UACR (mg/g Cr)83.3 ± 30.4
HbA1c (%)6.7 ± 0.1
SBP (mm Hg)129 ± 2
DBP (mm Hg)77 ± 2
Hypertension (+/-)26/8
Urate-lowering agents
  Allopurinol5
  Benzbromarone8
  Febuxostat21
Medication for diabetes
  Insulin7 (21%)
  Sulfonylurea10 (29%)
  Glinide3 (9%)
  GLP-1 RA1 (3%)
  DPP-4 inhibitor25 (74%)
  Biguanide17 (50%)
  Thiazolidine7 (21%)
  SGLT2 inhibitor6 (18%)
  αGI4 (12%)
Other medication
  ARBs/ACEI25 (74%)


Table 2. Changes in Serum Urate, eGFR and UACR
 
0 weekUrate < 6.0 mg/dL52 weeks
*P < 0.05 vs. 0 week.
Serum urate (mg/dL)7.8 ± 0.15.1 ± 0.2*5.2 ± 0.2*
eGFR (mL/min/1.73 m2)66.0 ± 3.172.0 ± 3.7*71.0 ± 3.9*
  No albuminuria64.0 ± 3.568.4 ± 3.4*69.5 ± 4.0*
  Microalbuminuria78.7 ± 5.988.5 ± 7.9*87.1 ± 8.5
  Macroalbuminuria50.9 ± 5.354.7 ± 5.951.0 ± 3.9
UACR (mg/g Cr)83.3 ± 30.484.6 ± 34.3
  No albuminuria12.3 ± 2.76.6 ± 0.9*
  Microalbuminuria44.1 ± 10.833.8 ± 6.2
  Macroalbuminuria402.9 ± 121.4451.2 ± 135.1


Table 3. Changes in eGFR and UACR by Urate-Lowering Agents
 
0 weekUrate < 6.0 mg/dL52 weeks
*P < 0.05 vs. 0 week.
eGFR (mL/min/1.73 m2)
  Allopurinol76.0 ± 6.880.0 ± 5.582.4 ± 9.8
  Benzbromarone74.7 ± 6.988.1 ± 10.0*85.0 ± 9.0*
  Febuxostat60.3 ± 3.664.8 ± 3.9*63.1 ± 3.9
UACR (mg/g Cr)
  Allopurinol22.9 ± 9.313.5 ± 6.0
  Benzbromarone9.7 ± 1.915.2 ± 6.4
  Febuxostat119.3 ± 44.7121.3 ± 50.8