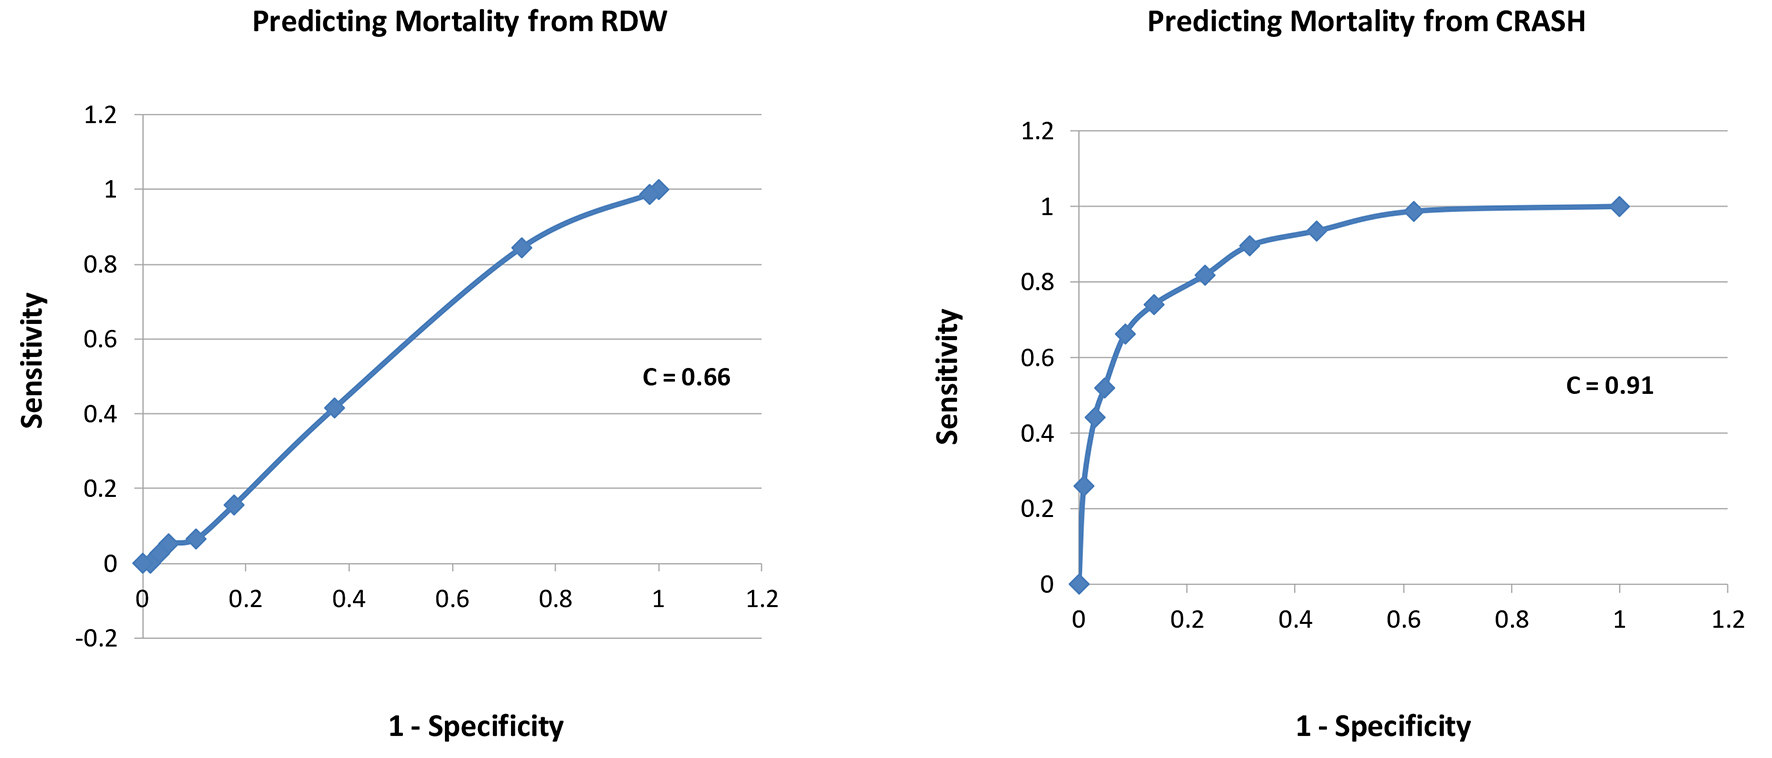
Figure 1. Receiver-operating characteristic curves for each of RDW and CRASH for prediction of mortality.
| Journal of Clinical Medicine Research, ISSN 1918-3003 print, 1918-3011 online, Open Access |
| Article copyright, the authors; Journal compilation copyright, J Clin Med Res and Elmer Press Inc |
| Journal website http://www.jocmr.org |
Original Article
Volume 10, Number 1, January 2018, pages 9-12
Does Red Cell Distribution Width Predict Outcome in Traumatic Brain Injury: Comparison to Corticosteroid Randomization After Significant Head Injury
Figures
Tables
| Survivors | Non-survivors | P-value | |
|---|---|---|---|
| N, % | 339 (81.5) | 77 (18.5) | |
| Age (mean ± SD) | 58 ± 23 | 58 ± 23 | 1.0 |
| Gender (male, %) | 63 | 69 | 0.3 |
| GCS (mean ± SD) | 12 ± 3 | 5 ± 3 | 0.0001 |
| RDW (mean ± SD) | 13.9 ± 1.5 | 14.0 ± 1.2 | 0.6 |
| CRASH (mean ± SD) | 24 ± 22 | 68 ± 26 | 0.0001 |
| Odds ratio | P value | |
|---|---|---|
| Red cell distribution width (%) | ||
| < 13 | 1.0 | Reference |
| 13 - 13.9 | 8.0 | 0.005 |
| 14 - 14.9 | 18 | 0.0001 |
| 15 - 15.9 | 10 | 0.001 |
| 16 - 16.9 | 4.3 | 0.03 |
| > 17 | 6.7 | 0.01 |
| CRASH (%) | ||
| < 10 | 1.0 | Reference |
| 11 - 30 | 2.0 | 0.1 |
| 31 - 50 | 6.0 | 0.01 |
| 51 - 70 | 16 | 0.0001 |
| 71 - 90 | 41 | 0.0001 |
| > 90 | 77 | 0.0001 |