Figures
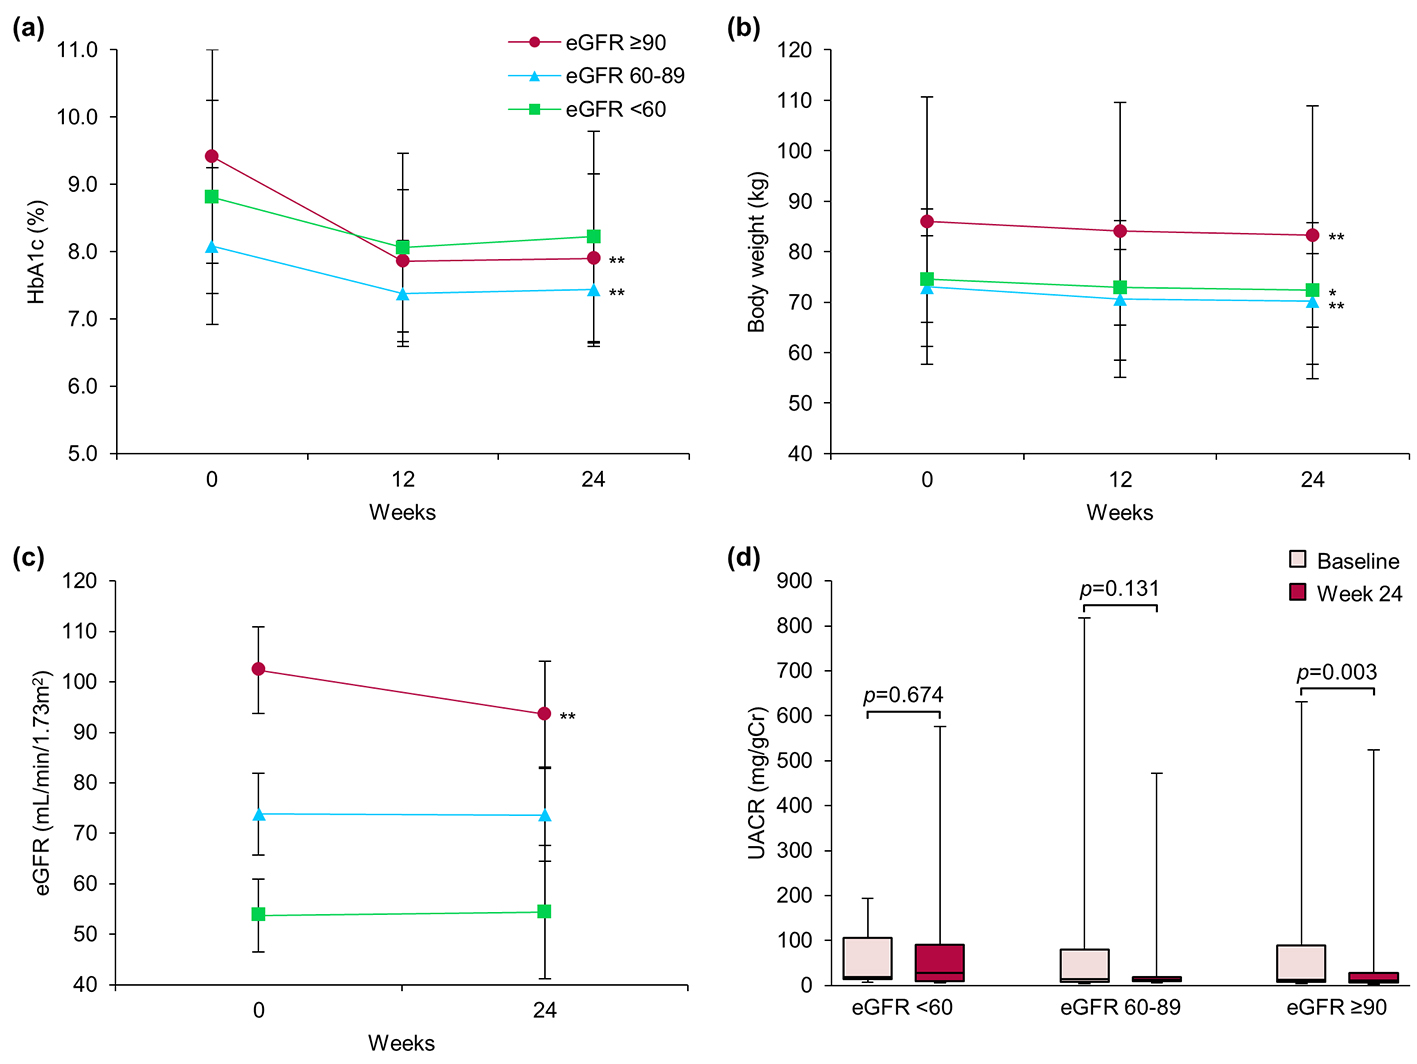
Figure 1. Effect of ipragliflozin on efficacy parameters at week 24 in all patients (n = 50), classified according to estimated glomerular filtration rate (eGFR) at baseline into three groups: eGFR ≥ 90 (circles; n = 20), eGFR ≥ 60 to < 90 (triangles; n = 22), and eGFR < 60 (squares; n = 8). (a) Change from baseline in glycated hemoglobin (HbA1c) to week 24 after starting ipragliflozin administration. (b) Change from baseline in body weight. (c) Change from baseline in eGFR. (d) Change from baseline in urinary albumin-to-creatinine ratio (UACR) at week 24. Data are means ± standard deviation (SD) or medians with the interquartile range (IQR). *P < 0.05, **P < 0.01 versus baseline by the paired t-test. For the UACR, the Wilcoxon signed-rank test was used to evaluate changes between the baseline and week 24. Error bars show SDs or IQRs.
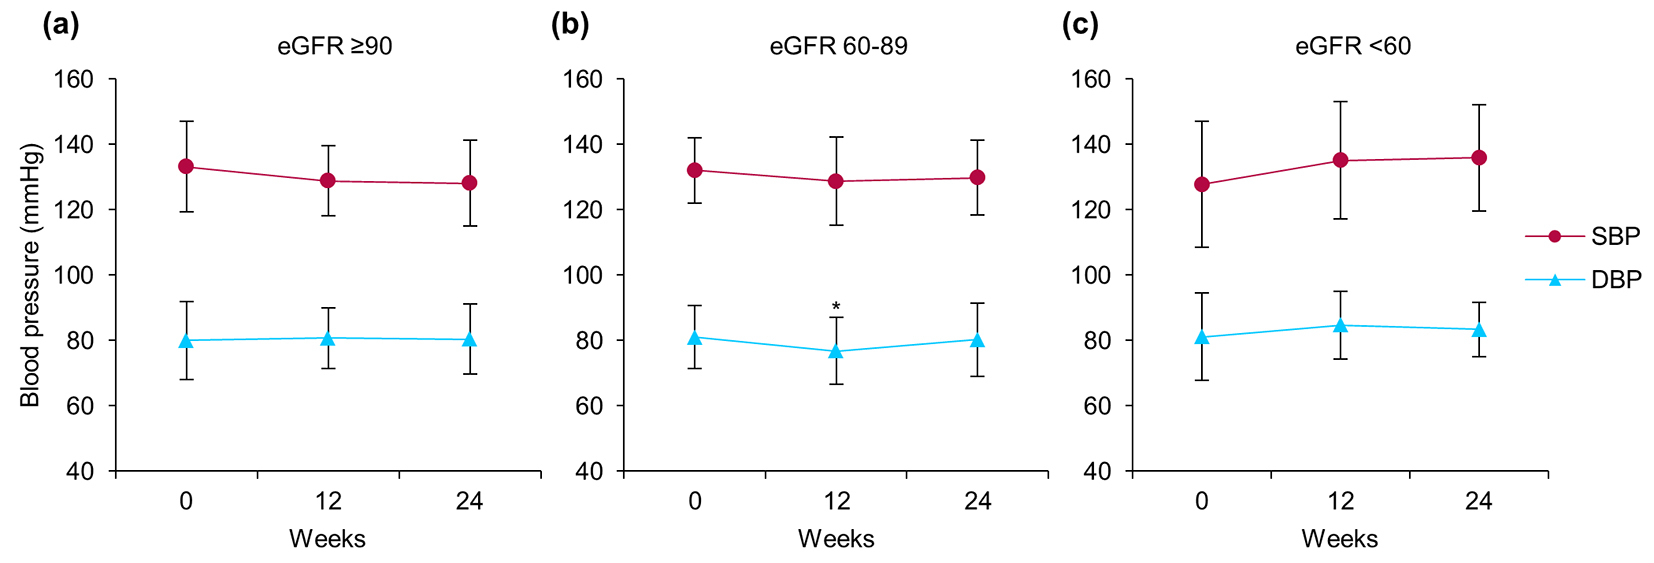
Figure 2. Changes in systolic blood pressure (circles) and diastolic blood pressure (triangles) from baseline to week 24 after starting ipragliflozin administration, classified according to estimated glomerular filtration rate (eGFR): (a) eGFR ≥ 90 (n = 20), (b) eGFR ≥ 60 to < 90 (n = 22), and (c) eGFR < 60 (n = 8) at baseline. Data are means ± standard deviation (SD). *P < 0.05 versus baseline by the paired t-test. Error bars show SDs.
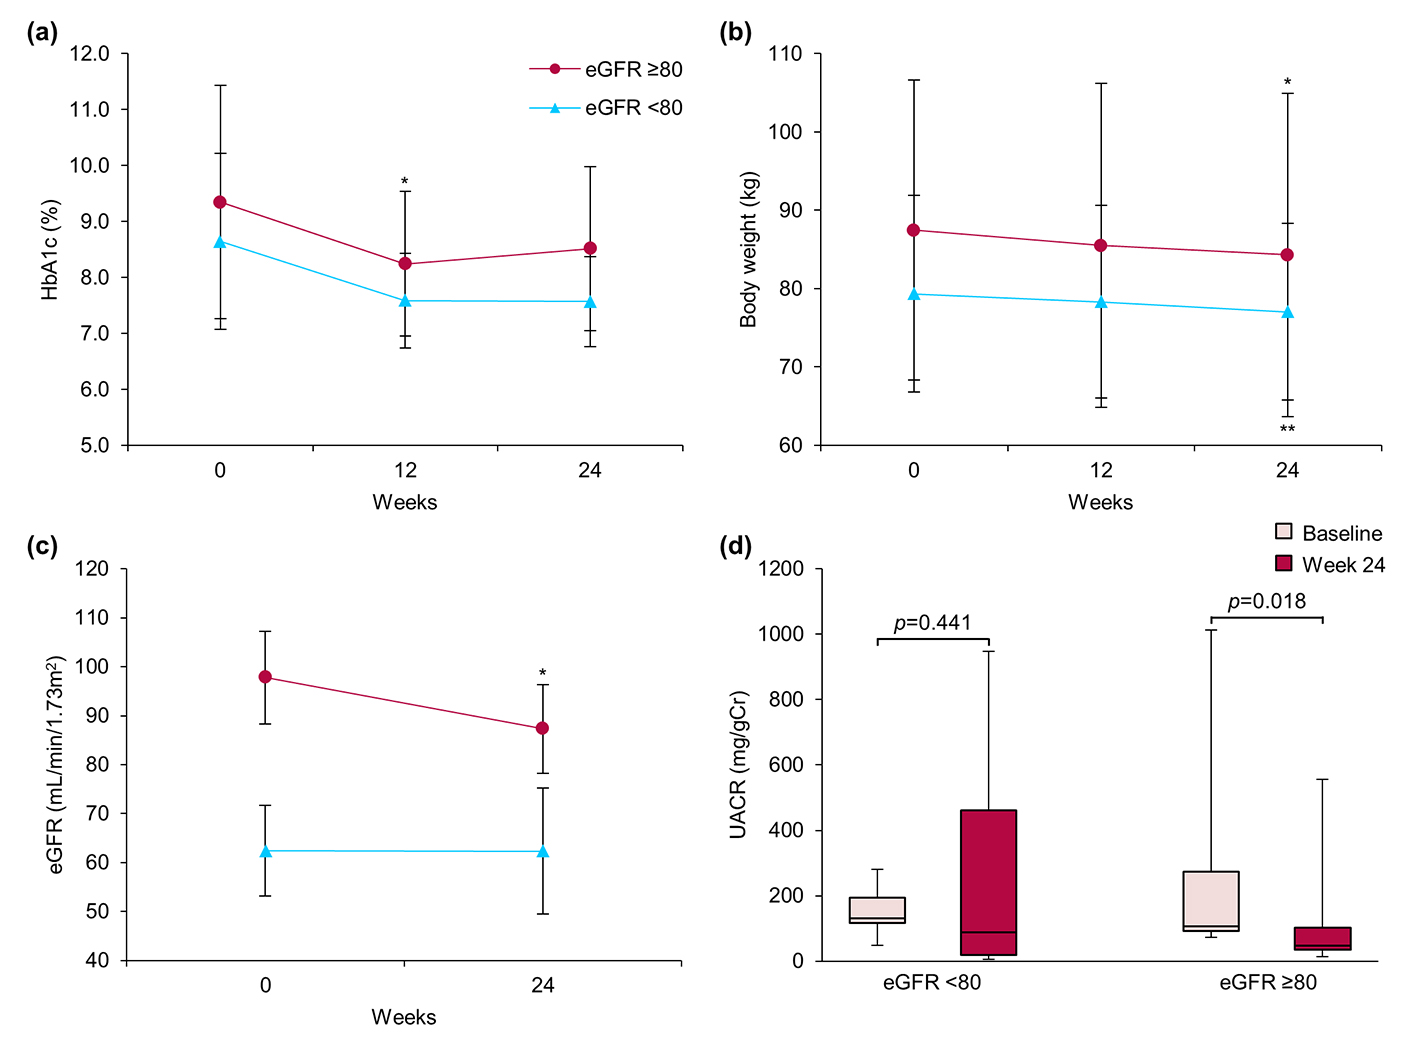
Figure 3. Effect of ipragliflozin on efficacy parameters at week 24 in patients with diabetic nephropathy (n = 16), classified according to estimated glomerular filtration rate (eGFR) at baseline into two groups: eGFR ≥ 80 (circles; n = 7) and eGFR < 80 (triangles; n = 9). (a) Change from baseline in glycated hemoglobin (HbA1c) to week 24 after starting ipragliflozin administration. (b) Change from baseline in body weight. (c) Change from baseline in eGFR. (d) Change from baseline in urinary albumin-to-creatinine ratio (UACR) at week 24. Data are means ± standard deviation (SD) or medians with the interquartile range (IQR). *P < 0.05 versus baseline by the paired t-test. For the UACR, the Wilcoxon signed-rank test was used to evaluate changes between the baseline and week 24. Error bars show SDs or IQRs.
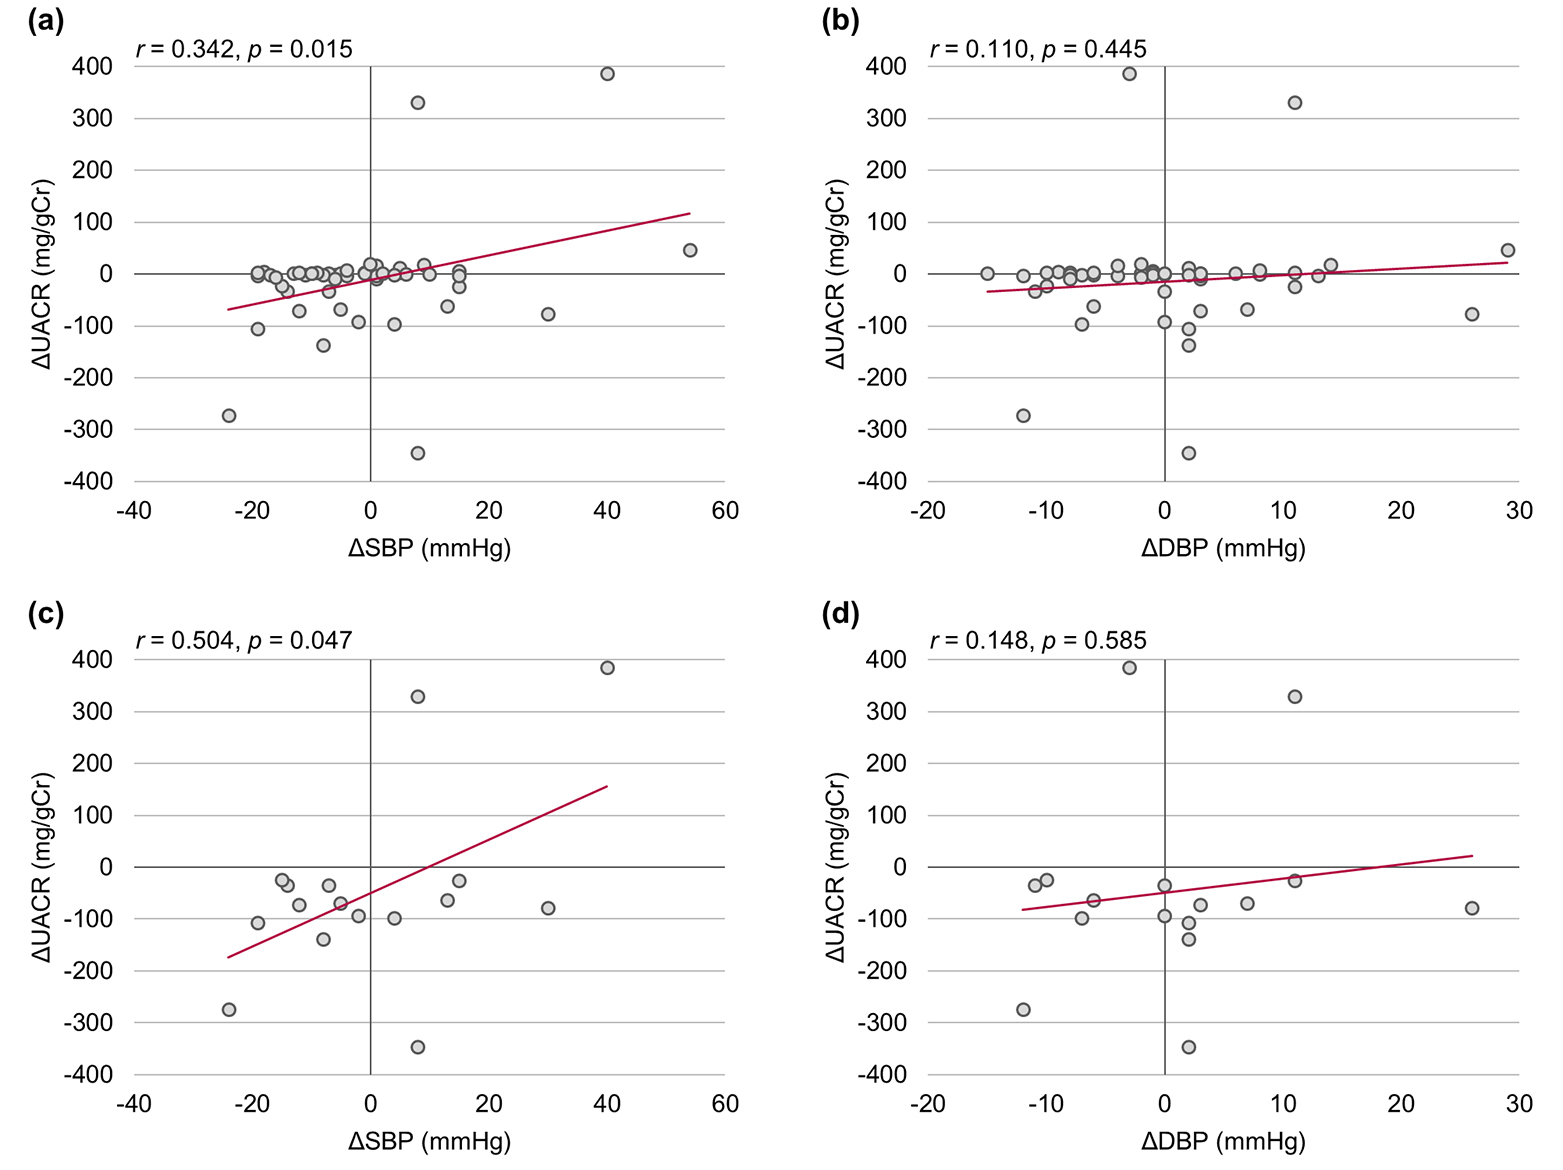
Figure 4. Correlations among urinary albumin-to-creatinine ratio (UACR), systolic blood pressure (SBP), and diastolic blood pressure (DBP). (a, b) All patients (n = 50). (c, d) Patients with diabetic nephropathy (n = 16). The relationship between change in UACR and blood pressure was assessed using Pearson’s correlation coefficients. Δ: the amount of change 24 weeks after baseline.
Tables
Table 1. Baseline Characteristics
| All patients | Diabetic nephropathy |
|---|
| Data are n (%), means ± standard deviation (SD), or medians with the interquartile range (IQR). HbA1c: glycated hemoglobin; eGFR: estimated glomerular filtration rate; UACR: urinary albumin-to-creatinine ratio; DPP-4: dipeptidyl peptidase-4; ARB: angiotensin receptor blocker; ACE: angiotensin-converting enzyme. |
| Number of patients | 50 | 16 |
| Male/female (n) | 16/34 | 6/10 |
| Age (years) | 53.2 ± 12.5 | 53.8 ± 13.3 |
| Duration of diabetes (years) | 9.1 ± 6.0 | 9.9 ± 7.2 |
| Body weight (kg) | 78.4 ± 19.7 | 82.9 ± 15.7 |
| Body mass index (kg/m2) | 30.6 ± 6.2 | 32.1 ± 4.5 |
| HbA1c (NGSP) (%) | 8.7 ± 1.5 | 9.0 ± 1.8 |
| Fasting plasma glucose (mg/dL) | 165.5 ± 40.5 | 162.5 ± 32.1 |
| Fasting C-peptide (ng/mL) | 3.4 ± 1.8 | 3.5 ± 1.03 |
| eGFR (mL/min/1.73 m2) | 82.1 ± 19.8 | 77.9 ± 20.2 |
| UACR (mg/gCr) | 15.5 (8.0 - 85.7) | 119.2 (98.9 - 201.8) |
| Systolic blood pressure (mm Hg) | 131.8 ± 13.1 | 135.5 ± 17.2 |
| Diastolic blood pressure (mm Hg) | 80.7 ± 11.0 | 83.9 ± 12.4 |
| Medications | | |
| Metformin (%) | 31 (62.0%) | 10 (62.5%) |
| DPP-4 inhibitor (%) | 31 (62.0%) | 8 (50.0%) |
| Sulfonylurea (%) | 10 (20.0%) | 2 (12.5%) |
| Insulin (%) | 12 (24.0%) | 5 (31.3%) |
| ARB or ACE inhibitor (%) | 32 (64.0%) | 13 (81.3%) |
| Statin (%) | 32 (64.0%) | 10 (62.5%) |
Table 2. Changes in the Characteristics of Patients Between Baseline and Week 24
| All patients (n = 50) | Diabetic nephropathy (n = 16) |
|---|
| Baseline | Week 24 | P value | Baseline | Week 24 | P value |
|---|
| Data are means ± standard deviation (SD) or medians with the interquartile range (IQR). P value versus baseline by the paired t-test. †P value versus baseline by the Wilcoxon signed-rank test. HbA1c: glycated hemoglobin; eGFR: estimated glomerular filtration rate; UACR: urinary albumin-to-creatinine ratio; SBP: systolic blood pressure; DBP: diastolic blood pressure; HOMA-IR: homeostasis model assessment of insulin resistance; HOMA-β: homeostasis model assessment-β; LDL-cholesterol: low-density lipoprotein cholesterol; HDL-cholesterol: high-density lipoprotein cholesterol; AST: aspartate aminotransferase; ALT: alanine aminotransferase; γ-GT: γ-glutamyltransferase. |
| HbA1c (%) | 8.7 ± 1.5 | 7.7 ± 1.2 | < 0.001 | 9.0 ± 1.8 | 8.0 ± 1.2 | 0.013 |
| Fasting plasma glucose (mg/dL) | 165.5 ± 40.5 | 137.6 ± 25.6 | < 0.001 | 162.5 ± 32.1 | 135.9 ± 20.2 | 0.028 |
| Body weight (kg) | 78.4 ± 19.7 | 75.8 ± 20.1 | < 0.001 | 82.9 ± 15.7 | 80.2 ± 15.9 | < 0.001 |
| Visceral fat area (cm2) | 152.1 ± 72.2 | 124.5 ± 54.0 | < 0.001 | 160.5 ± 58.4 | 130.1 ± 56.1 | < 0.001 |
| Subcutaneous fat area (cm2) | 279.3 ± 154.2 | 252.0 ± 144.2 | < 0.001 | 280.0 ± 135.0 | 249.0 ± 115.5 | 0.002 |
| Waist circumference (cm) | 100.6 ± 14.8 | 97.0 ± 15.2 | < 0.001 | 103.5 ± 12.8 | 99.7 ± 12.7 | < 0.001 |
| UACR (mg/gCr) | 15.5 (8.0 - 95.7) | 12.9 (7.4 - 36.3) | 0.011† | 119.2 (98.9 - 201.8) | 52.9 (24.8 - 242.1) | 0.049† |
| eGFR (mL/min/1.73 m2) | 82.1 ± 19.8 | 78.5 ± 17.4 | 0.007 | 77.9 ± 20.2 | 73.3 ± 16.9 | 0.080 |
| SBP (mm Hg) | 131.8 ± 13.1 | 130.1 ± 13.0 | 0.389 | 135.5 ± 17.2 | 134.3 ± 14.5 | 0.822 |
| DBP (mm Hg) | 80.7 ± 11.0 | 80.8 ± 10.5 | 0.888 | 83.9 ± 12.4 | 84.7 ± 11.4 | 0.769 |
| Fasting serum insulin (μU/mL) | 13.4 ± 6.3 | 13.2 ± 11.5 | 0.924 | 14.5 ± 6.0 | 18.3 ± 16.4 | 0.325 |
| HOMA-IR | 5.5 ± 3.4 | 4.7 ± 5.0 | 0.378 | 5.7 ± 2.5 | 6.5 ± 7.2 | 0.702 |
| HOMA-β (%) | 54.7 ± 35.3 | 67.0 ± 44.0 | 0.064 | 59.4 ± 41.3 | 88.5 ± 55.9 | 0.024 |
| Total cholesterol (mg/dL) | 180.8 ± 39.8 | 184.1 ± 39.8 | 0.274 | 184.6 ± 31.9 | 183.2 ± 19.7 | 0.848 |
| LDL-cholesterol (mg/dL) | 106.1 ± 32.2 | 109.3 ± 34.1 | 0.199 | 107.0 ± 32.2 | 104.6 ± 20.4 | 0.483 |
| HDL-cholesterol (mg/dL) | 48.3 ± 9.51 | 54.1 ± 10.4 | < 0.001 | 48.9 ± 8.8 | 54.2 ± 10.5 | 0.036 |
| Triglycerides (mg/dL) | 157.1 ± 77.3 | 134.1 ± 71.7 | 0.028 | 168.1 ± 82.2 | 140.3 ± 84.3 | 0.160 |
| Free fatty acids (mEq/L) | 0.72 ± 0.31 | 0.76 ± 0.24 | 0.477 | 0.78 ± 0.41 | 0.77 ± 0.24 | 0.886 |
| Adiponectin (μg/mL) | 5.7 ± 1.4 | 6.7 ± 1.7 | 0.078 | 6.0 ± 0.6 | 6.4 ± 1.0 | 0.314 |
| AST (IU/L) | 39.4 ± 16.7 | 26.0 ± 8.6 | < 0.001 | 39.0 ± 17.8 | 27.2 ± 11.5 | < 0.001 |
| ALT (IU/L) | 56.2 ± 29.7 | 35.6 ± 19.5 | < 0.001 | 55.9 ± 32.7 | 40.9 ± 27.9 | < 0.001 |
| γ-GT (IU/L) | 62.3 ± 55.6 | 41.0 ± 34.5 | < 0.001 | 54.2 ± 34.8 | 37.3 ± 22.6 | < 0.001 |
| Uric acid (mg/dL) | 5.5 ± 1.3 | 4.7 ± 1.1 | < 0.001 | 5.9 ± 1.4 | 5.2 ± 1.2 | 0.022 |