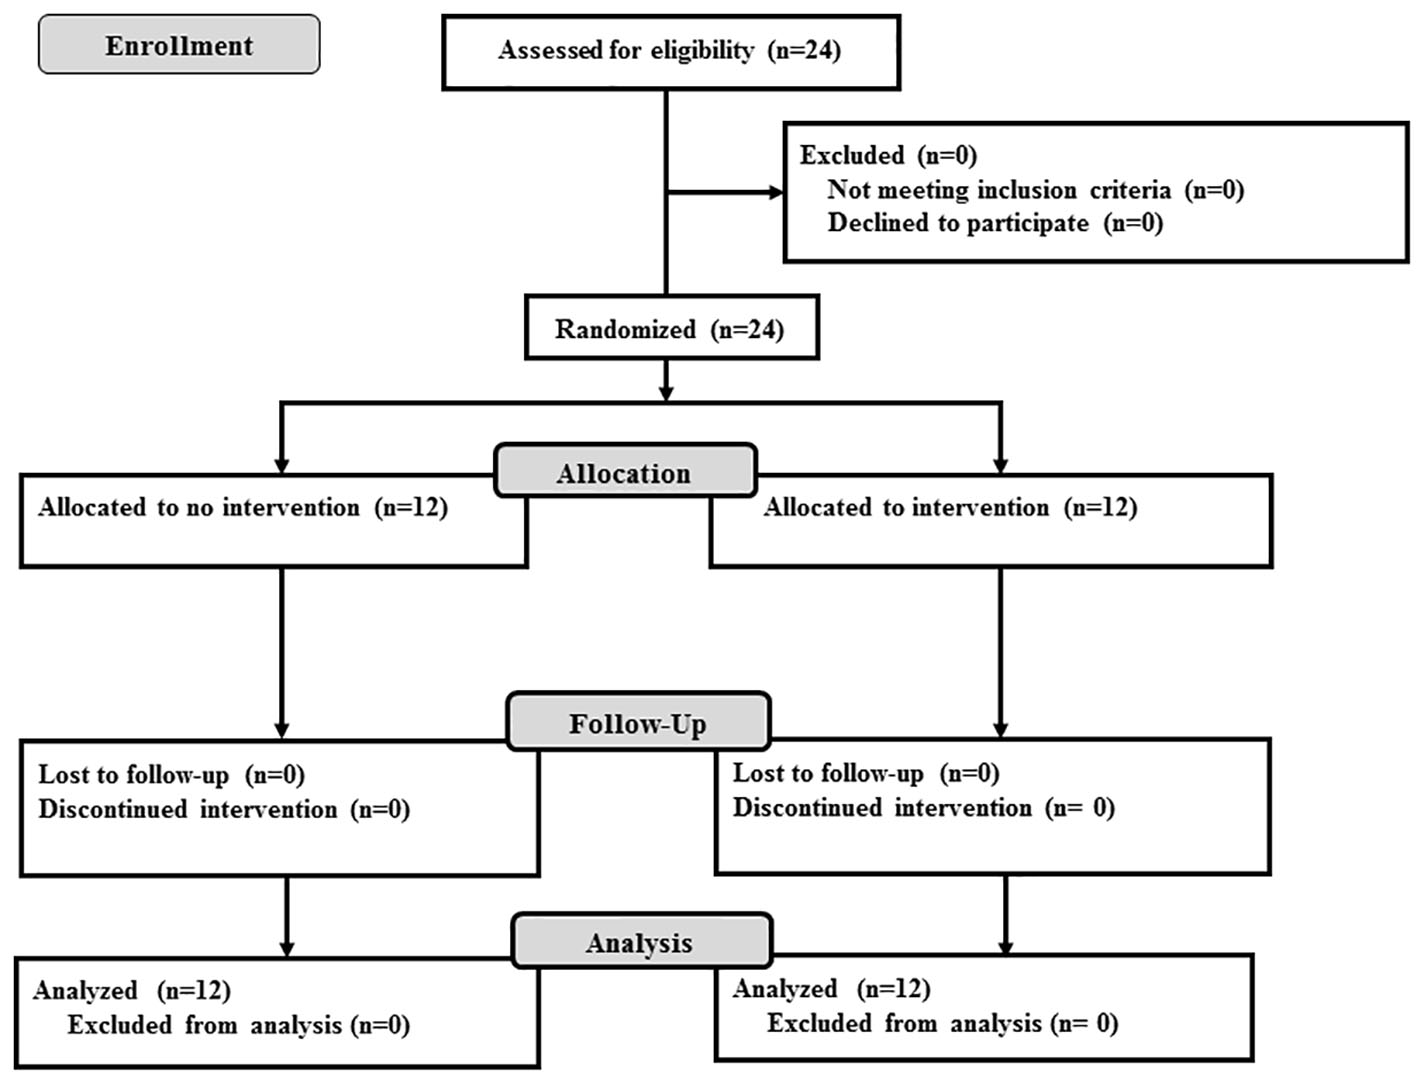
Figure 1. Flow diagram of patient recruitment. Twenty-four patients were randomly allocated to either the control group or the vildagliptin group. All patients were followed up for 6 months.
| Journal of Clinical Medicine Research, ISSN 1918-3003 print, 1918-3011 online, Open Access |
| Article copyright, the authors; Journal compilation copyright, J Clin Med Res and Elmer Press Inc |
| Journal website http://www.jocmr.org |
Original Article
Volume 9, Number 3, March 2017, pages 193-199
Efficacy and Safety of Vildagliptin as an Add-On Therapy in Inadequately Controlled Type 2 Diabetes Patients Treated With Basal Insulin
Figures
Tables
| Control | Vildagliptin | P-value | |
|---|---|---|---|
| Data are mean ± SD or median (interquartile range). BMI: body mass index; HDL-C: high-density lipoprotein cholesterol; UAE: urinary albumin excretion; 1,5-AG: 1,5-anhydroglucitol. | |||
| n | 12 | 12 | |
| Gender (males/females) | 8/4 | 11/1 | |
| Age (years) | 61.7 ± 10.0 | 60.0 ± 11.4 | 0.688 |
| BMI (kg/m2) | 24.8 ± 5.3 | 25.6 ± 5.4 | 0.719 |
| Systolic blood pressure (mm Hg) | 132.3 ± 17.7 | 134.2 ± 17.4 | 0.816 |
| Diastolic blood pressure (mm Hg) | 72.3 ± 13.1 | 80.1 ± 11.5 | 0.183 |
| Diabetes duration (years) | 10.5 ± 9.1 | 14.2 ± 8.8 | 0.327 |
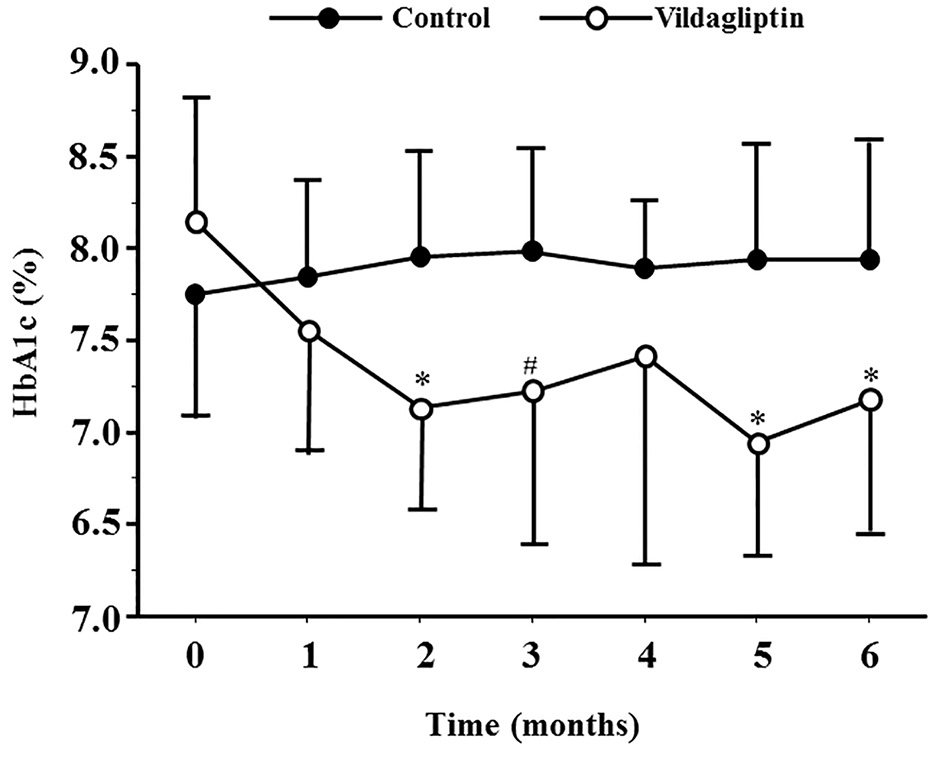
| HbA1c (%) | 7.7 ± 0.6 | 8.1 ± 0.7 | 0.172 |
| 1,5-AG (μg/mL) | 6.4 ± 3.4 | 4.4 ± 3.3 | 0.183 |
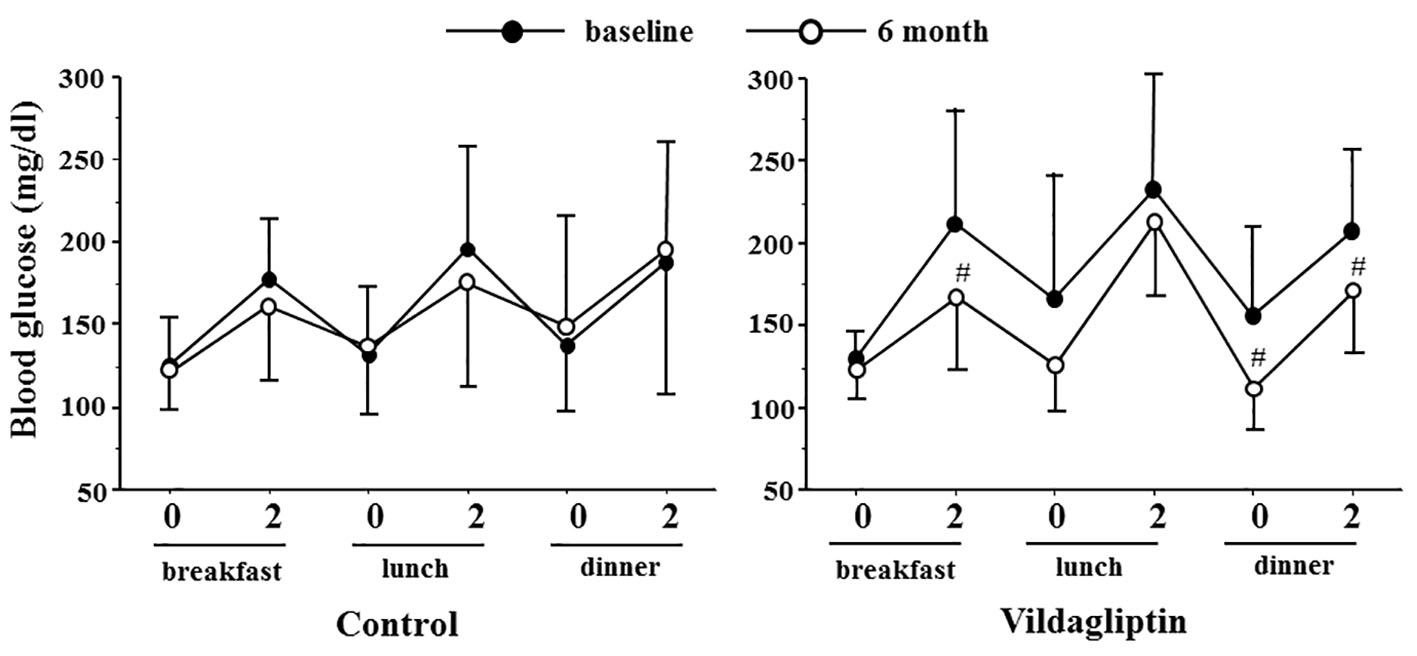
| Fasting blood glucose (mg/dL) | 133.1 ± 32.3 | 144.1 ± 30.1 | 0.397 |
| C-peptide (ng/mL) | 2.7 ± 2.5 | 1.9 ± 1.1 | 0.385 |
| C-peptide index | 1.89 ± 1.46 | 1.38 ± 0.76 | 0.337 |
| Total cholesterol (mg/dL) | 194.3 ± 35.8 | 163.9 ± 26.8 | 0.056 |
| HDL-C (mg/dL) | 54.9 ± 21.7 | 44.0 ± 12.4 | 0.158 |
| Triglyceride (mg/dL) | 121.2 ± 59.9 | 120.6 ± 42.2 | 0.978 |
| UAE (mg/gCre) | 9.8 (3.7 - 78.0) | 18.8 (12.0 - 21.8) | 0.449 |
| Medications for diabetes | |||
| Oral anti-diabetes therapy | |||
| Sulfonyl urea (n) | 6 | 6 | |
| Metformin (n) | 9 | 9 | |
| α-GI inhibitor (n) | 3 | 1 | |
| Thiazolidine (n) | 1 | 2 | |
| Glinide (n) | 0 | 1 | |
| Insulin dose (units) | 9.4 ± 2.3 | 10.4 ± 6.4 | 0.619 |
| Insulin type | |||
| Detemir | 1 | 2 | |
| Glargine | 8 | 8 | |
| Degludec | 3 | 2 | |
| Control | Vildagliptin | P-value | |
|---|---|---|---|
| Data are mean ± SD or median (interquartile range). BMI: body mass index; HDL-C: high-density lipoprotein cholesterol; UAE: urinary albumin excretion; 1,5-AG: 1,5-anhydroglucitol. | |||
| BMI (kg/m2) | 0.13 ± 0.44 | 0.51 ± 0.81 | 0.183 |
| Fasting blood glucose (mg/dL) | 6.5 ± 24.6 | -6.3 ± 43.6 | 0.400 |
| C-peptide index (ng/mL) | -0.14 ± 1.09 | 0.83 ± 1.54 | 0.107 |
| UAE (mg/gCre) | 3.95 (-18.5 - 10.8) | 0.4 (-6.4 - 5.1) | 0.722 |
| Insulin unit (unit/day) | 1.0 ± 2.2 | 2.5 ± 2.2 | 0.130 |
| HbA1c (%) | -1.0 ± 0.3 | 0.2 ± 0.8 | < 0.01 |
| 1,5-AG (μg/mL) | 4.5 ± 3.4 | 0.5 ± 4.1 | 0.03 |